Review
. 2010 Jun;20(3):367-75.
doi: 10.1016/j.conb.2010.04.006. Epub 2010 May 6.

Neural computations underlying depth perception

Affiliations
Review

Neural computations underlying depth perception

Akiyuki Anzai et al. Curr Opin Neurobiol. 2010 Jun.

Abstract

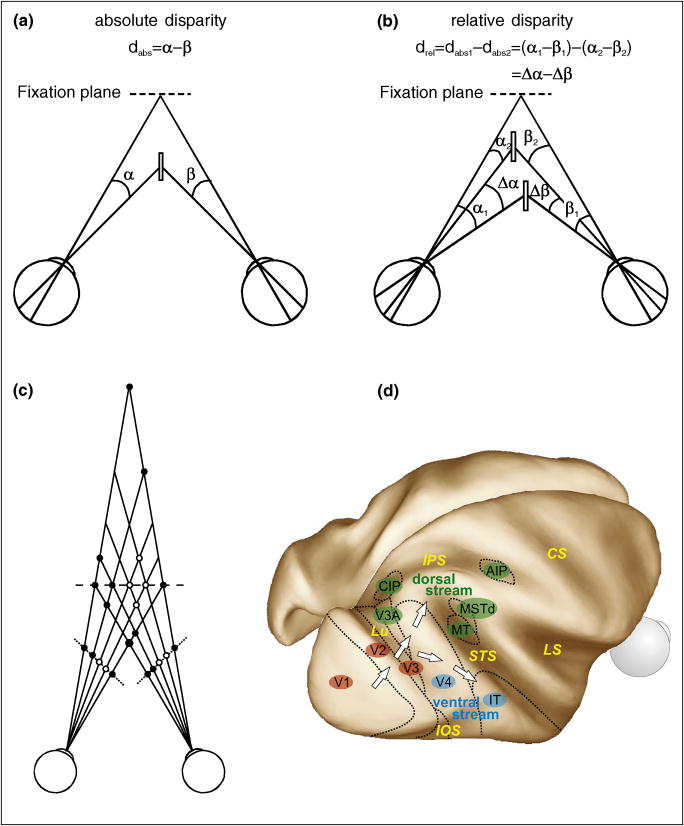
Neural mechanisms underlying depth perception are reviewed with respect to three computational goals: determining surface depth order, gauging depth intervals, and representing 3D surface geometry and object shape. Accumulating evidence suggests that these three computational steps correspond to different stages of cortical processing. Early visual areas appear to be involved in depth ordering, while depth intervals, expressed in terms of relative disparities, are likely represented at intermediate stages. Finally, 3D surfaces appear to be processed in higher cortical areas, including an area in which individual neurons encode 3D surface geometry, and a population of these neurons may therefore represent 3D object shape. How these processes are integrated to form a coherent 3D percept of the world remains to be understood.


Figures

Figure I
Figure I
(a) Absolute disparity. (b) Relative disparity. (c) Correspondence problem and false matches. (d) Cortical areas and two major visual processing streams. Locations of cortical areas described in this article are mapped onto a postero-dorso-lateral view of a partially inflated macaque brain (Caret Software 5.61 http://brainvis.wustl.edu/caret), to expose visual areas that lie within sulci. Dotted lines indicate approximate areal boundaries. Early visual areas (V1, V2, and V3) are marked by red ovals, whereas areas that are considered to belong to the dorsal stream (V3A, MT: middle temporal, MSTd: dorsal medial superior temporal, CIP: caudal intraparietal, and AIP: anterior intraparietal) and the ventral stream (V4, IT: inferior temporal) are indicated by green and blue ovals, respectively. Major sulci are labeled in yellow (CS: central sulcus, IPS: intraparietal sulcus, IOS: inferior occipital sulcus, LS: lateral sulcus, Lu: lunate sulcus, STS: superior temporal sulcus).
Figure 1
Figure 1
The Kanizsa triangle. (a) Three panels are shown for stereo viewing by free fusion. Adapted from [4] with permission of ABC-CLIO, LLC (Copyright © 1979 by Gaetano Kanizsa). Each of the panels viewed alone (non-stereo viewing) produces a percept of a white triangle lying on top of three black disks and a second upside-down triangle outlined in black. The white triangle is illusory, yet its contours are sharp and the interior of the triangle appears slightly brighter than the background. The Kanizsa triangle displays three phenomena. (1) Modal contour completion: the white triangle is formed by illusory contours extended from the straight, real luminance edges of pacman-like shapes. (2) Amodal contour completion: the V-shaped lines are extended behind the white triangle to form the second triangle. The arced edge of each pacman-like shape is also extended to form a disk. In either case, the extended contours are not visible as if they are occluded by the white triangle. (3) Border ownership: the straight edges of the pacman shapes, as well as the illusory contours that run over the second triangle, appear to belong to the white triangle. (b) When the figure in (a) is viewed stereoscopically to introduce a near disparity to the white triangle (either by diverging the eyes—fixating behind the figure—to fuse the left and middle panels or by converging the eyes—fixating in front of the figure—to fuse the middle and right panels), the white triangle appears to float above the rest of the figure as depicted here. The illusory contours now appear sharper, and the occlusion is more compelling. (c) On the other hand, when a far disparity is introduced to the white triangle (by fusing the remaining panel with the middle one in (a)) so that the white triangle lies explicitly behind the rest of the figure, it is now the white triangle that appears to be occluded. The figure appears as if we are looking at a white wall with three circular holes and V-shaped slots in it, and behind the wall is a white triangle on a dark background as depicted here. The white triangle is now formed by amodal contours that connect its tips (the straight edges of pacman-like shapes). The contour of each circular hole consists of real (the arced portion of the pacman shape) and illusory (modally completed) portions, both of which belong to the white wall.
Figure 2
Figure 2
Modal and amodal contour responses and border ownership selectivity. (a) Peri-stimulus time histograms (PSTHs) of responses of an orientation selective neuron from monkey V1 to the stimuli depicted above each PSTH. The neuron responded to an elongated bar stimulus presented over the receptive field, but did not respond to two unconnected bar segments placed outside the receptive field either with or without a patch covering the receptive field. However, the neuron responded when the patch was placed at a near depth to facilitate amodal contour completion, but not when the patch was placed at a far depth, which does not induce amodal contours. Adapted from [7] with permission (Copyright © 1999 by Macmillan Publishers Ltd.). (b) Responses of a monkey V2 neuron to various stimuli depicted below each bar graph. The left panel shows the disparity tuning of this neuron measured with an elongated bar (the dashed square represents the receptive field). The right panel shows responses of the neuron to various combinations of two bar segments placed just outside the receptive field and a rectangular patch over the receptive field. The neuron did not respond to these stimuli except when the two bar segments were presented at a near depth to induce modal contour completion. Reproduced from [8] with permission (Copyright © 2000 by Society for Neuroscience). (c) Raster plots for responses of a V2 neuron to various figure-ground stimuli. The black oval in each stimulus depiction indicates the receptive field. In each row, the stimulus within the receptive field is identical but the location of the square patch (defined by a difference in luminance or disparity) relative to the receptive field is different. This neuron responded whenever the luminance-defined figure resided on the left side of the receptive field (i, iii) or whenever the surface on the left side of the receptive field was in front (v, vi), suggesting that it can signal border ownership assignment to the left regardless of the stimulus cues defining the border. Reproduced from [11] with permission (Copyright © 2005 by Elsevier Inc.).
Figure 3
Figure 3
Tuning of an IT neuron for 3D surface geometry. Reproduced from [51••] with permission (Copyright © 2008 by Macmillan Publishers Ltd.). (a) The most effective stimulus for this neuron is shown. It was obtained after eight generations of stimulus evolution based on the neuron's responses. (b) The neuron responded well as long as the 3D shape of the stimulus was defined either by binocular disparity or shading cues, thus exhibiting some degree of cue-invariance. Texture cues alone were not sufficient for this neuron. (c) Variations in shading pattern produced by changing the lighting direction along the horizontal (black curve) or vertical (green curve) direction did not affect the neuron's response. (d) The response was largely independent of stimulus position in depth. (e) Stimulus size also did not affect the response. (f) Rotation of the stimulus about the x-axis (black) and y-axis (green) strongly suppressed the response, while rotation about the z-axis (blue) was tolerated over a range of about 90°.

References

    1. Wheatstone C. On some remarkable, and hitherto unobserved, phenomena of binocular vision. Philos Trans of the Royal Soc of London. 1838;128:371–394. - PubMed
    1. Julesz B. Foundation of cyclopean perception. Chicago: The University of Chicago Press; 1971.
    1. Nakayama K. Binocular visual surface perception. Proc Natl Acad Sci U S A. 1996;93:634–639. - PMC - PubMed
    1. Kanizsa G. Organization in Vision: Essays on Gestalt Perception. New York: Praeger; 1979.
    1. von der Heydt R, Peterhans E, Baumgartner G. Illusory contours and cortical neuron responses. Science. 1984;224:1260–1262. - PubMed

Publication types