

A distance-weighted interaction map reveals a previously uncharacterized layer of the Bacillus subtilis spore coat
- PMID: 20451384
- PMCID: PMC2920530
- DOI: 10.1016/j.cub.2010.03.060
A distance-weighted interaction map reveals a previously uncharacterized layer of the Bacillus subtilis spore coat
Abstract
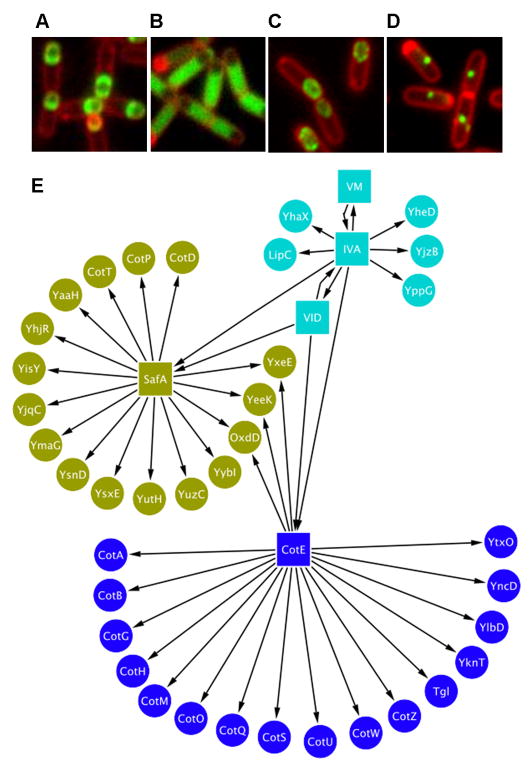
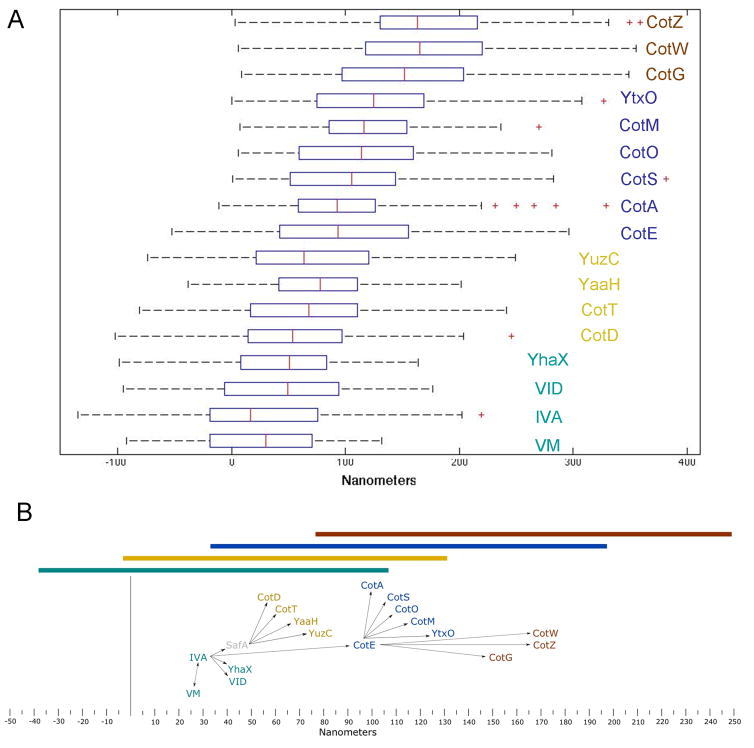
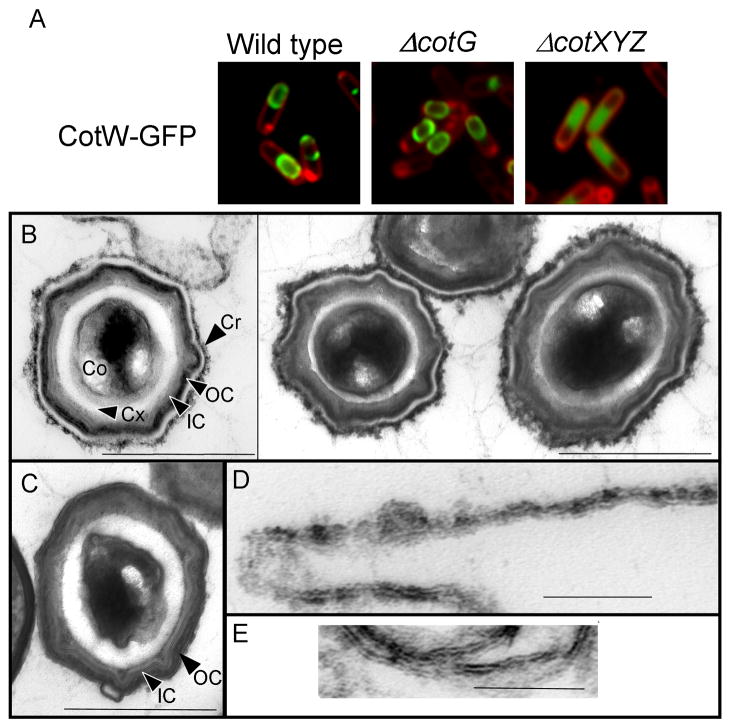
Bacillus subtilis spores are encased in a protein assembly called the spore coat that is made up of at least 70 different proteins. Conventional electron microscopy shows the coat to be organized into two distinct layers. Because the coat is about as wide as the theoretical limit of light microscopy, quantitatively measuring the localization of individual coat proteins within the coat is challenging. We used fusions of coat proteins to green fluorescent protein to map genetic dependencies for coat assembly and to define three independent subnetworks of coat proteins. To complement the genetic data, we measured coat protein localization at subpixel resolution and integrated these two data sets to produce a distance-weighted genetic interaction map. Using these data, we predict that the coat comprises at least four spatially distinct layers, including a previously uncharacterized glycoprotein outermost layer that we name the spore crust. We found that crust assembly depends on proteins we predicted to localize to the crust. The crust may be conserved in all Bacillus spores and may play critical functions in the environment.
Copyright 2010 Elsevier Ltd. All rights reserved.
Figures
Similar articles
-
[Identification and characterization of the outermost layer of Bacillus subtilis spores].Yakugaku Zasshi. 2012;132(8):919-24. doi: 10.1248/yakushi.132.919. Yakugaku Zasshi. 2012. PMID: 22864350 Review. Japanese.
-
Dynamic patterns of subcellular protein localization during spore coat morphogenesis in Bacillus subtilis.J Bacteriol. 2004 Jul;186(14):4441-8. doi: 10.1128/JB.186.14.4441-4448.2004. J Bacteriol. 2004. PMID: 15231775 Free PMC article.
-
Architecture and assembly of the Bacillus subtilis spore coat.PLoS One. 2014 Sep 26;9(9):e108560. doi: 10.1371/journal.pone.0108560. eCollection 2014. PLoS One. 2014. PMID: 25259857 Free PMC article.
-
Proteins involved in formation of the outermost layer of Bacillus subtilis spores.J Bacteriol. 2011 Aug;193(16):4075-80. doi: 10.1128/JB.05310-11. Epub 2011 Jun 10. J Bacteriol. 2011. PMID: 21665972 Free PMC article.
-
Assembly and genetics of spore protective structures.Cell Mol Life Sci. 2002 Mar;59(3):434-44. doi: 10.1007/s00018-002-8436-4. Cell Mol Life Sci. 2002. PMID: 11964122 Free PMC article. Review.
Cited by
-
Structural, Metabolic and Evolutionary Comparison of Bacterial Endospore and Exospore Formation.Front Microbiol. 2021 Mar 9;12:630573. doi: 10.3389/fmicb.2021.630573. eCollection 2021. Front Microbiol. 2021. PMID: 33767680 Free PMC article. Review.
-
The sps Genes Encode an Original Legionaminic Acid Pathway Required for Crust Assembly in Bacillus subtilis.mBio. 2020 Aug 18;11(4):e01153-20. doi: 10.1128/mBio.01153-20. mBio. 2020. PMID: 32817102 Free PMC article.
-
Contributions of crust proteins to spore surface properties in Bacillus subtilis.Mol Microbiol. 2019 Mar;111(3):825-843. doi: 10.1111/mmi.14194. Epub 2019 Jan 30. Mol Microbiol. 2019. PMID: 30582883 Free PMC article.
-
Cell Death Pathway That Monitors Spore Morphogenesis.Trends Microbiol. 2017 Aug;25(8):637-647. doi: 10.1016/j.tim.2017.03.005. Epub 2017 Apr 10. Trends Microbiol. 2017. PMID: 28408070 Free PMC article. Review.
-
Immobilization of Bioactive Protein A from Staphylococcus aureus (SpA) on the Surface of Bacillus subtilis Spores.Mol Biotechnol. 2015 Aug;57(8):756-66. doi: 10.1007/s12033-015-9868-z. Mol Biotechnol. 2015. PMID: 25840905
References
-
- Robinson CV, Sali A, Baumeister W. The molecular sociology of the cell. Nature. 2007;450:973–982. - PubMed
-
- Alber F, Dokudovskaya S, Veenhoff LM, Zhang W, Kipper J, Devos D, Suprapto A, Karni-Schmidt O, Williams R, Chait BT, Sali A, Rout MP. The molecular architecture of the nuclear pore complex. Nature. 2007;450:695–701. - PubMed
-
- Schmid EM, McMahon HT. Integrating molecular and network biology to decode endocytosis. Nature. 2007;448:883–888. - PubMed
Publication types
MeSH terms
Substances
Grants and funding
LinkOut - more resources
Full Text Sources
Other Literature Sources
Molecular Biology Databases
