

Chromatin immunoprecipitation assays revealed CREB and serine 133 phospho-CREB binding to the CART gene proximal promoter
- PMID: 20451507
- PMCID: PMC2906763
- DOI: 10.1016/j.brainres.2010.04.069
Chromatin immunoprecipitation assays revealed CREB and serine 133 phospho-CREB binding to the CART gene proximal promoter
Abstract
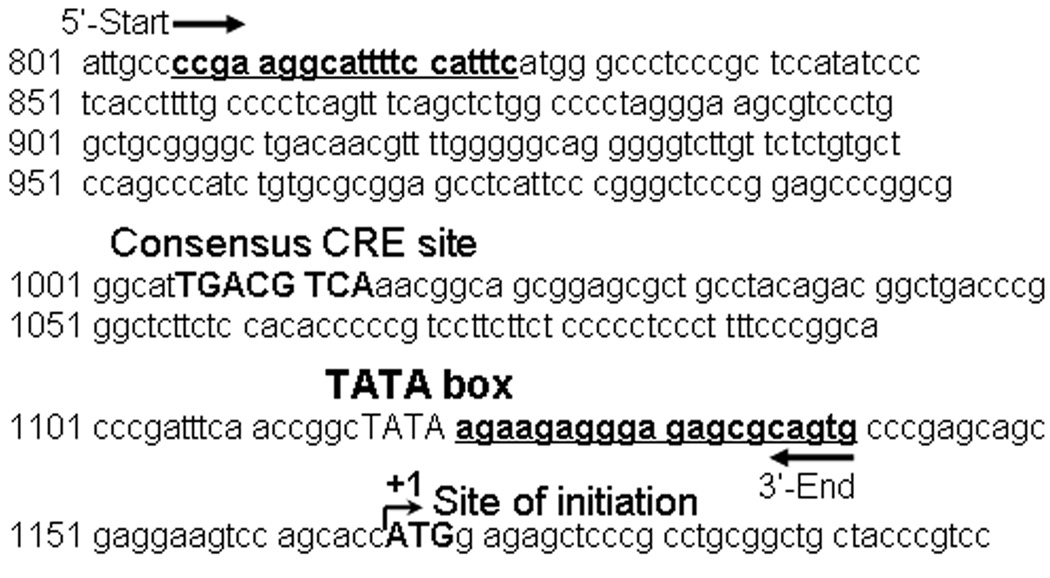
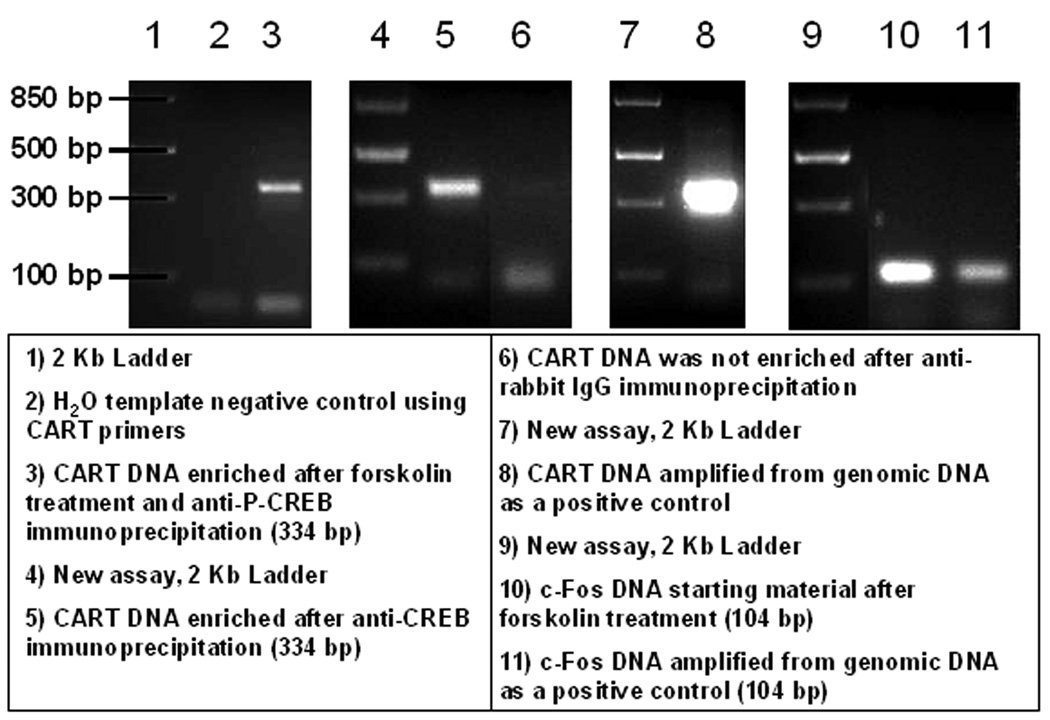
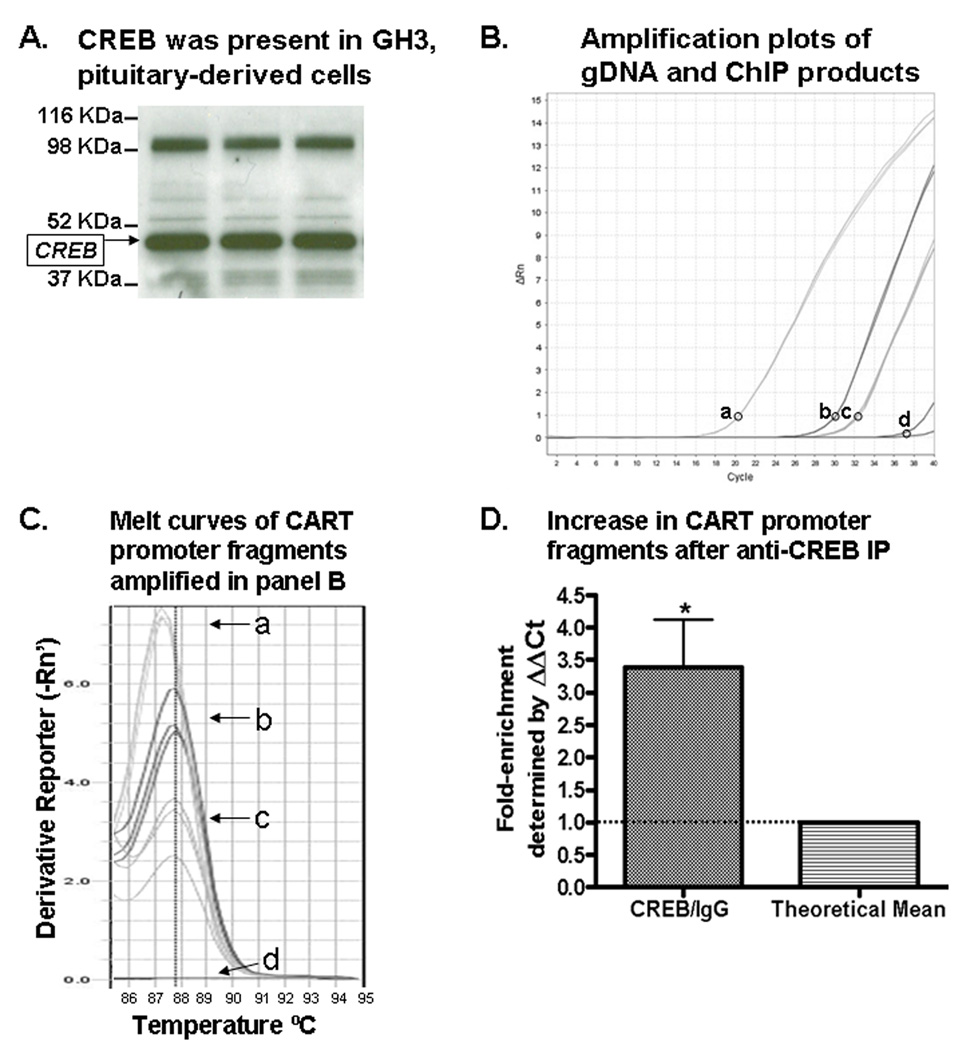
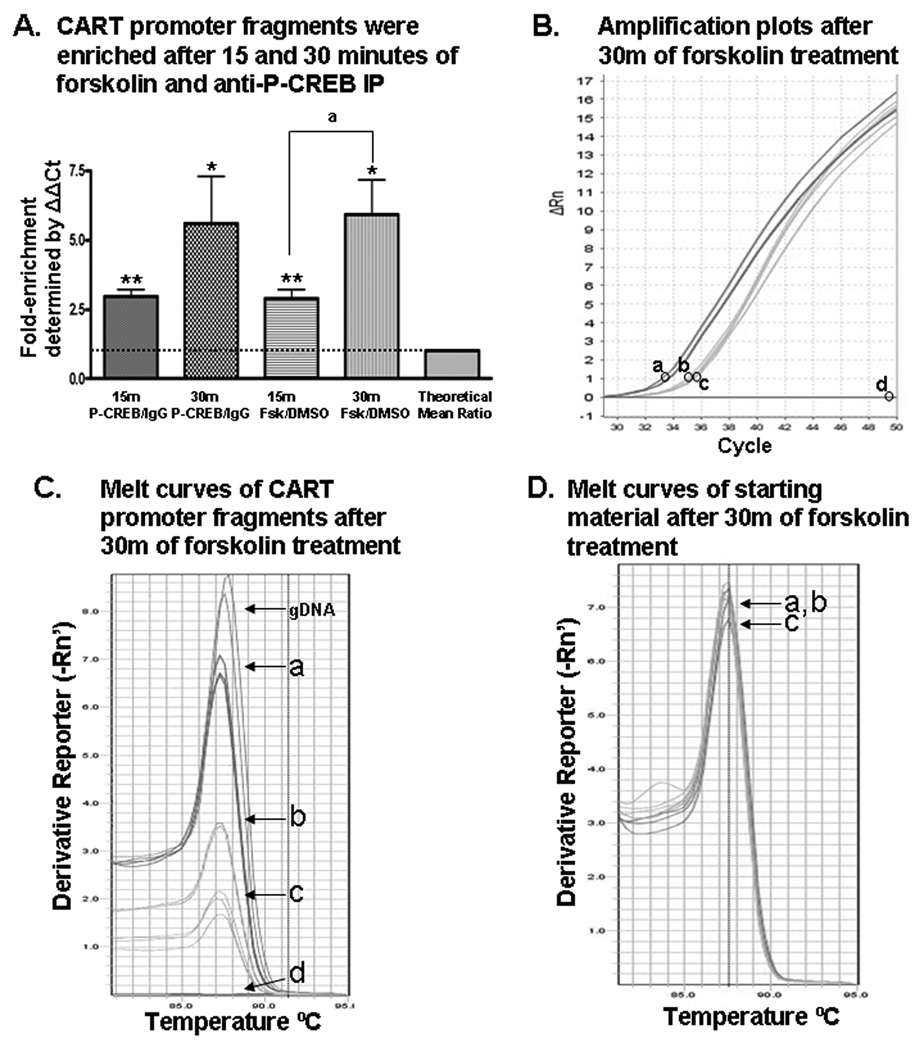
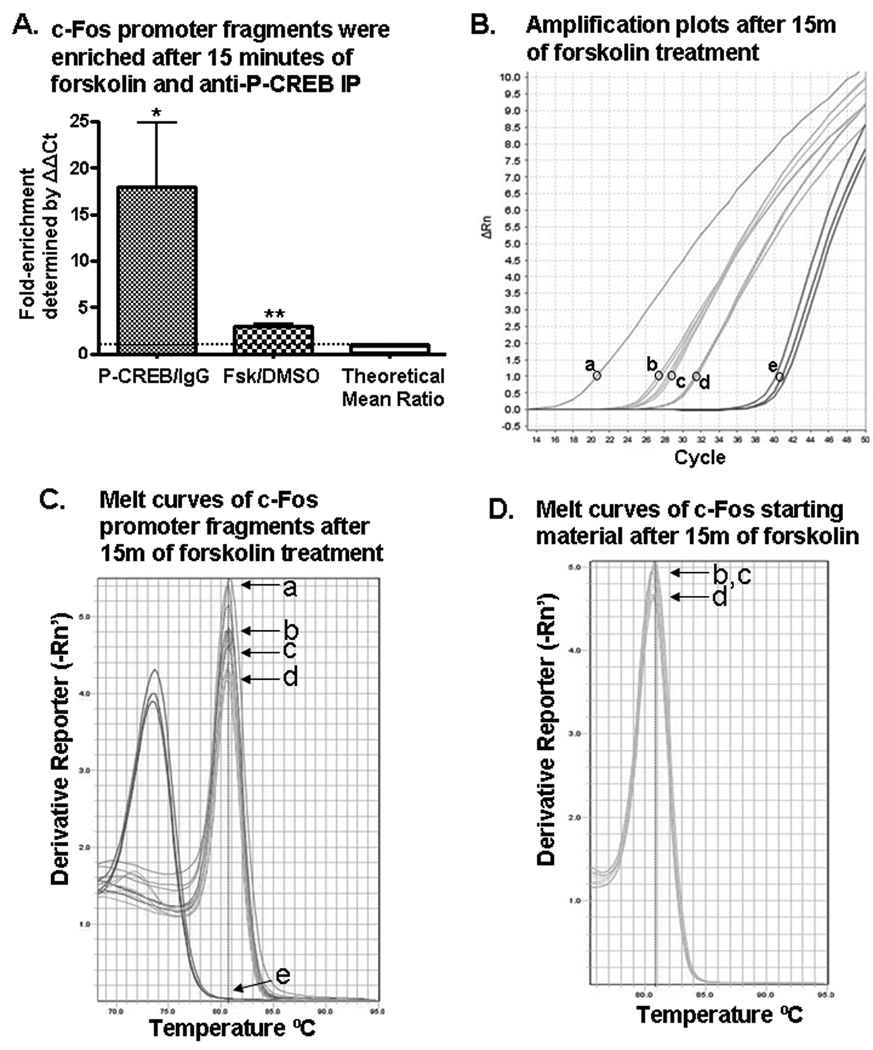
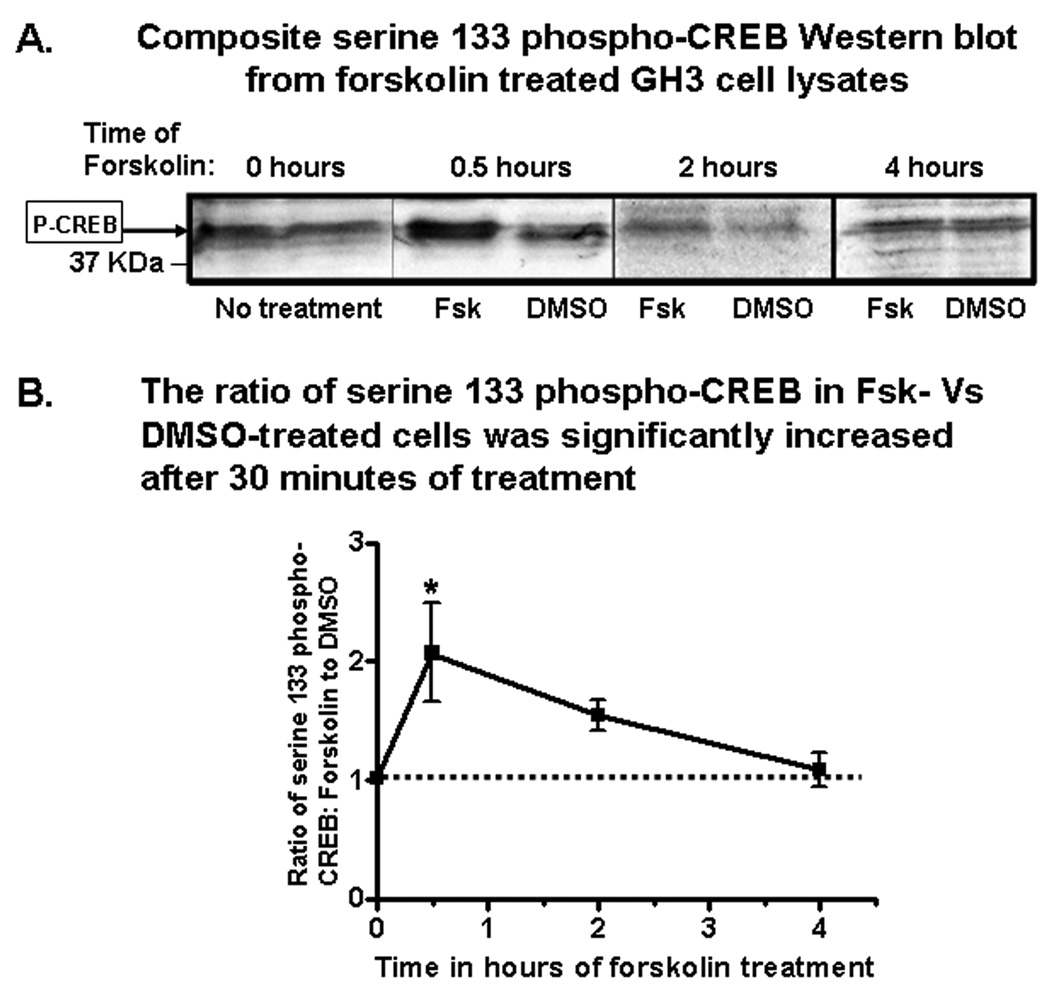
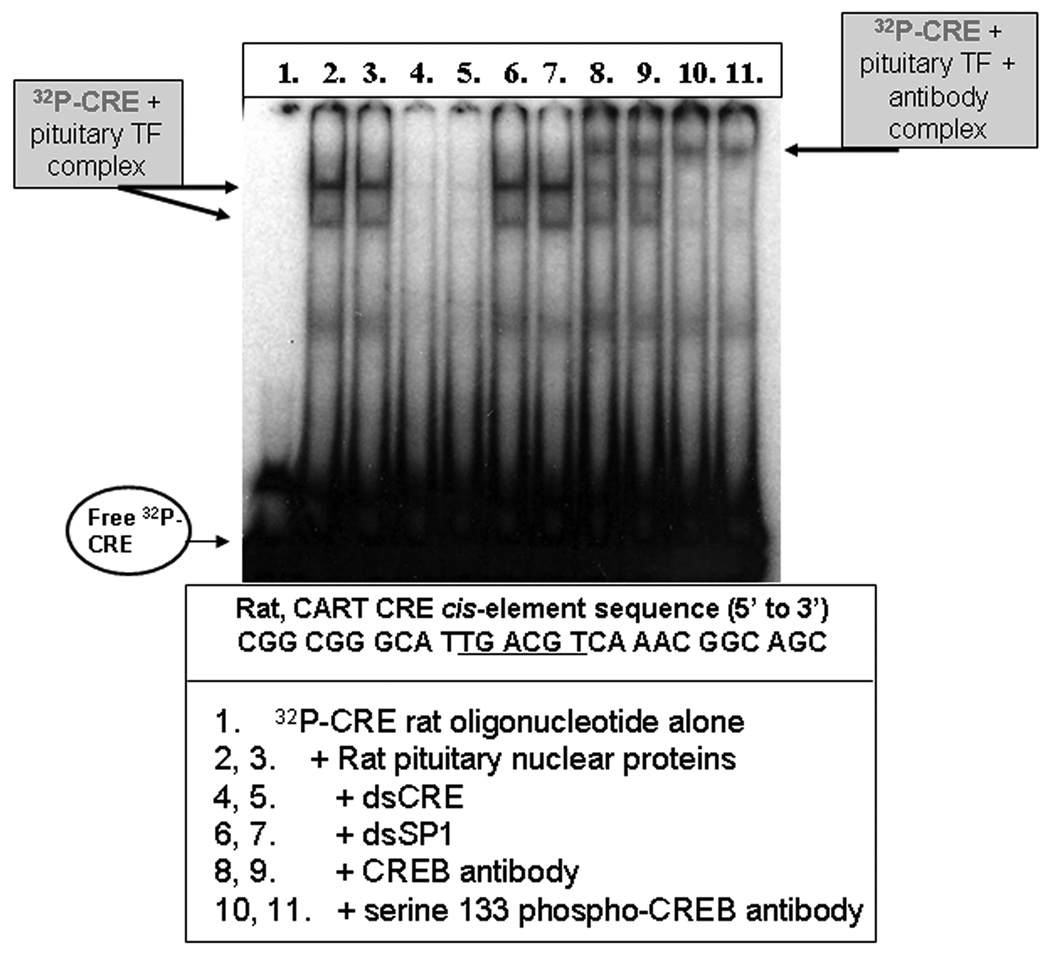
Both over expression of cyclic AMP response element binding protein (CREB) in the nucleus accumbens (NAc), and intra-accumbal injection of cocaine- and amphetamine-regulated transcript (CART) peptides, have been shown to decrease cocaine reward. Also, over expression of CREB in the rat NAc increased CART mRNA and peptide levels, but it is not known if this was due to a direct action of P-CREB on the CART gene promoter. The goal of this study was to test if CREB and P-CREB bound directly to the CRE site in the CART promoter, using chromatin immunoprecipitation (ChIP) assays. ChIP assay with anti-CREB antibodies showed an enrichment of the CART promoter fragment containing the CRE region over IgG precipitated material, a non-specific control. Forskolin, which was known to increase CART mRNA levels in GH3 cells, was utilized to show that the drug increased levels of P-CREB protein and P-CREB binding to the CART promoter CRE-containing region. A region of the c-Fos promoter containing a CRE cis-regulatory element was previously shown to bind P-CREB, and it was used here as a positive control. These data suggest that the effects of CREB over expression on blunting cocaine reward could be, at least in part, attributed to the increased expression of the CART gene by direct interaction of P-CREB with the CART promoter CRE site, rather than by some indirect action.
Copyright (c) 2010 Elsevier B.V. All rights reserved.
Figures
Similar articles
-
Regulation of CART peptide expression by CREB in the rat nucleus accumbens in vivo.Brain Res. 2009 Jan 28;1251:42-52. doi: 10.1016/j.brainres.2008.11.011. Epub 2008 Nov 14. Brain Res. 2009. PMID: 19046951 Free PMC article.
-
CART promoter CRE site binds phosphorylated CREB.Brain Res Mol Brain Res. 2002 Jul 15;104(1):81-5. doi: 10.1016/s0169-328x(02)00321-2. Brain Res Mol Brain Res. 2002. PMID: 12117553
-
Cocaine-amphetamine-regulated transcript expression in the rat nucleus accumbens is regulated by adenylyl cyclase and the cyclic adenosine 5'-monophosphate/protein kinase a second messenger system.J Pharmacol Exp Ther. 2006 Apr;317(1):454-61. doi: 10.1124/jpet.105.096123. Epub 2005 Dec 1. J Pharmacol Exp Ther. 2006. PMID: 16322355
-
Characterization of the cocaine- and amphetamine-regulated transcript (CART) peptide gene promoter and its activation by a cyclic AMP-dependent signaling pathway in GH3 cells.J Neurochem. 2002 Mar;80(5):885-93. doi: 10.1046/j.0022-3042.2002.00775.x. J Neurochem. 2002. PMID: 11948252
-
Cocaine- and amphetamine-regulated transcript peptides play a role in drug abuse and are potential therapeutic targets.AAPS J. 2005 Sep 2;7(1):E259-65. doi: 10.1208/aapsj070125. AAPS J. 2005. PMID: 16146347 Free PMC article. Review.
Cited by
-
Effects of Atipamezole Preconditioning on Cognitive Function and Protein Expression in Related Brain Regions of Aged Rats after General Anesthesia.Dis Markers. 2022 Apr 27;2022:7731333. doi: 10.1155/2022/7731333. eCollection 2022. Dis Markers. 2022. Retraction in: Dis Markers. 2023 Jul 19;2023:9861026. doi: 10.1155/2023/9861026. PMID: 35531473 Free PMC article. Retracted.
-
δ-Opioid Receptor Activation Attenuates the Oligomer Formation Induced by Hypoxia and/or α-Synuclein Overexpression/Mutation Through Dual Signaling Pathways.Mol Neurobiol. 2019 May;56(5):3463-3475. doi: 10.1007/s12035-018-1316-1. Epub 2018 Aug 21. Mol Neurobiol. 2019. PMID: 30132200
-
Long glucocorticoid-induced leucine zipper regulates human thyroid cancer cell proliferation.Cell Death Dis. 2018 Feb 21;9(3):305. doi: 10.1038/s41419-018-0346-y. Cell Death Dis. 2018. PMID: 29467389 Free PMC article.
-
Nitric oxide regulates synaptic transmission between spiny projection neurons.Proc Natl Acad Sci U S A. 2014 Dec 9;111(49):17636-41. doi: 10.1073/pnas.1420162111. Epub 2014 Nov 20. Proc Natl Acad Sci U S A. 2014. PMID: 25413364 Free PMC article.
-
CREB-Binding Protein Regulates Cocaine- and Amphetamine-Regulated Transcript Peptide Expression in the Lateral Hypothalamus: Implication in Reward and Reinforcement.Mol Neurobiol. 2025 Feb;62(2):1388-1403. doi: 10.1007/s12035-024-04338-7. Epub 2024 Jul 10. Mol Neurobiol. 2025. PMID: 38987488
References
-
- Douglass J, Daoud S. Characterization of the human cDNA and genomic DNA encoding CART: a cocaine- and amphetamine-regulated transcript. Gene. 1996;169(2):241–245. - PubMed
-
- Hunter RG, et al. The effects of cocaine on CART expression in the rat nucleus accumbens: a possible role for corticosterone. Eur J Pharmacol. 2005;517(1–2):45–50. - PubMed
-
- Marie-Claire C, et al. Fos but not Cart (cocaine and amphetamine regulated transcript) is overexpressed by several drugs of abuse: a comparative study using real-time quantitative polymerase chain reaction in rat brain. Neurosci Lett. 2003;345(2):77–80. - PubMed
-
- Vrang N, Larsen PJ, Kristensen P. Cocaine-amphetamine regulated transcript (CART) expression is not regulated by amphetamine. Neuroreport. 2002;13(9):1215–1218. - PubMed
Publication types
MeSH terms
Substances
Grants and funding
LinkOut - more resources
Full Text Sources
