. 2010 Jul 16;400(3):354-78.
doi: 10.1016/j.jmb.2010.04.065. Epub 2010 May 6.

The macroscopic rate of nucleic acid translocation by hepatitis C virus helicase NS3h is dependent on both sugar and base moieties

Affiliations

The macroscopic rate of nucleic acid translocation by hepatitis C virus helicase NS3h is dependent on both sugar and base moieties

Ali R Khaki et al. J Mol Biol. .

Abstract

The nonstructural protein 3 helicase (NS3h) of hepatitis C virus is a 3'-to-5' superfamily 2 RNA and DNA helicase that is essential for the replication of hepatitis C virus. We have examined the kinetic mechanism of the translocation of NS3h along single-stranded nucleic acid with bases uridylate (rU), deoxyuridylate (dU), and deoxythymidylate (dT), and have found that the macroscopic rate of translocation is dependent on both the base moiety and the sugar moiety of the nucleic acid, with approximate macroscopic translocation rates of 3 nt s(-1) (oligo(dT)), 35 nt s(-1) (oligo(dU)), and 42 nt s(-1) (oligo(rU)), respectively. We found a strong correlation between the macroscopic translocation rates and the binding affinity of the translocating NS3h protein for the respective substrates such that weaker affinity corresponded to faster translocation. The values of K(0.5) for NS3h translocation at a saturating ATP concentration are as follows: 3.3+/-0.4 microM nucleotide (poly(dT)), 27+/-2 microM nucleotide (poly(dU)), and 36+/-2 microM nucleotide (poly(rU)). Furthermore, results of the isothermal titration of NS3h with these oligonucleotides suggest that differences in TDeltaS(0) are the principal source of differences in the affinity of NS3h binding to these substrates. Interestingly, despite the differences in macroscopic translocation rates and binding affinities, the ATP coupling stoichiometries for NS3h translocation were identical for all three substrates (approximately 0.5 ATP molecule consumed per nucleotide translocated). This similar periodicity of ATP consumption implies a similar mechanism for NS3h translocation along RNA and DNA substrates.


Figures

Figure 1
Figure 1
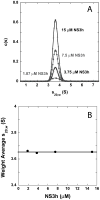
NS3h is a monomer in solution. (A) The c(s) distributions resulting from the analysis of sedimentation velocity experiments conducted at 25 °C and 42,000 RPM in translocation buffer with four different total NS3h concentrations: 15 μM (black open circles), 7.5 μM (gray filled circles), 3.75 μM (black open squares), and 1.87 μM (gray filled squares). NS3h absorbance measured at 280 nm. (B) The weight average estimate of s20,w calculated from the further analysis of the data in (A) is independent of the total concentration of NS3h in the reaction. Taken together, these data are consistent with NS3h existing as a homogenous stable monomer in solution.
Figure 2
Figure 2
Equilibrium binding of NS3h to DNA. (A) The c(s) distributions resulting from the analysis of sedimentation velocity experiments conducted at 25 °C and 48,000 RPM in translocation buffer at seven different molar concentration ratios of NS3h to 5-dT8-Cy5: 0:1 (black), 0.23:1 (red), 0.47:1 (blue), 0.94:1 (green), 1.41:1 (pink), 2.8:1 (light blue), and 5.6:1 (gray). The concentration of 5-dT8-Cy5 was 0.8 μM in all experiments. (B) The weight average sapp calculated from the further analysis of the data in (A) shows a break-point at a ratio of NS3h:DNA of 1.4:1. (C) The c(s) distributions resulting from the analysis of sedimentation velocity experiments conducted at 25 °C and 48,000 RPM in translocation buffer at seven different molar concentration ratios of NS3h to 5-ATG TGG AAA ATC TCT AGC A-Cy5: 0:1 (black), 0.5:1 (red), 1:1 (blue), 2:1 (green), 3:1 (pink), 4:1 (gray), and 5:1 (gold). The concentration of the DNA was 0.8 μM in all experiments. The absorbance of the DNA was measured at 648 nm. (D) The weight average sapp calculated from the further analysis of the data in (C) shows a breakpoint at a ratio of NS3h:DNA of 2.5:1.
Figure 3
Figure 3
Fluorescence anisotropy based measurements of the binding of NS3h to short oligonucleotides. (A) The binding of NS3h to 5′-F-dT6 (circles) and 5′-dT6-F (squares) as a function of the total concentration of NS3h in solution monitored by the changes in the fluorescence anisotropy of the fluorophore that occur upon the binding of NS3h to the oligonucleotides. The increase in the fluorescence anisotropy of the fluorophore is consistent with the NS3h bound oligonucleotide having a slower rotational diffusion time than the free oligonucleotide, as expected. (B) In experiments where non-fluorophore labeled oligonucleotide is included as a competitor for NS3h binding, the fluorescence anisotropy of the fluorophore labeled oligonucleotides decreases with increasing total concentration of the competitor. As shown in Table 1 and Table 2, the estimate of the affinity of NS3h binding to the unlabeled competitor molecule is independent of whether 5′-F-dT6 or 5′-dT6-F is used.
Figure 4
Figure 4
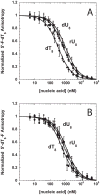
Fluorescence anisotropy based measurements of the affinity of NS3h binding to dT8 (filled circles), dU8 (open circles) and rU8 (squares) in competition with either 5′-F-dT6 (A) or 5′-dT6-F (B). Normalized fluorescence anisotropy changes are plotted as a function of unlabeled oligonucleotide concentrations. As show in Table 2, the estimates of the affinities of binding of NS3h to these short oligonucleotides are independent of whether 5′-F-dT6 or 5′-dT6-F are used and illustrate that the affinity of oligonucleotide binding by NS3h depends upon both the sugar and base moieties of the oligonucleotide.
Figure 5
Figure 5
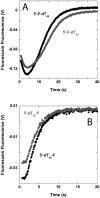
The single-stranded nucleic acid translocation by NS3h is biased in the 3′ to 5′ direction. (A) Fluorescence time courses resulting from the single-round translocation of NS3h along single-stranded nucleic acids labeled on the 5′ end with fluorescein: 5′-F-dT40 (black) and 5′-F-dT50 (gray). The dependence of the time courses on the length of the nucleic acid is consistent with 3′ to 5′ directionally biased nucleic acid translocation by NS3h. (B) Fluorescence time courses resulting from the single-round translocation of NS3h along single-stranded nucleic acids labeled on the 3′ end with fluorescein: 5′-dT40-F (black) and 5′-dT50-F (gray). Both time courses are well described by a single-exponential increase in the fluorescence of the fluorophore with an apparent rate constant that is independent of the length of the DNA. These data are also consistent with a 3′ to 5′ directionally biased nucleic acid translocation by NS3h.
Figure 6
Figure 6
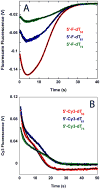
NS3h translocation kinetics monitored in single-round, stopped-flow experiments with fluorophore-labeled oligodeoxythymidylates. (A) Experiments conducted with 5′-F-dT53 (red), 5′-F-dT61 (blue), and 5′-F-dT73 (green). (B) Experiments conducted with 5′-Cy3-dT53 (red), 5′-Cy3-dT61 (blue), and 5′-Cy3-dT73 (green). The solid black lines in both panels are simulations using Equation (7) and the best fit parameters obtained from the NLLS analysis of the data in the panel to Equation (7).
Figure 7
Figure 7
NS3h translocation kinetics monitored in single-round, stopped-flow experiments with fluorophore labeled single-stranded nucleic acids. (A) Experiments conducted with 5′-F-dU53 (red), 5′-F-dU61 (blue), and 5′-F-dU73 (green). (B) Experiments conducted with 5′-F-rU53 (red), 5′-F-rU61 (blue), and 5′-F-rU73 (green). The solid black lines in both panels are simulations using Equation (7) and the best fit parameters obtained from the NLLS analysis of the data in the panel to Equation (7).
Figure 8
Figure 8
The magnitude of the nucleic acid stimulated ATPase activity of NS3h depends upon the sugar and base moieties of the nucleic acid. (A) The dependence of the ATPase activity of NS3h on the total concentration of nucleic acid in the reaction. The data clearly demonstrate that the magnitude of the increase in the ATPase activity is much larger in the presence of poly(dU) (open circles) and poly(rU) (squares) than in the presence of poly(dT) (filled circles). (B) A normalized plot of the data in (A). The solid lines in both panels are simulations using Equation (11) and the best fit parameters obtained from the NLLS analysis of the data in the panel to Equation (11).
Figure 9
Figure 9
Representative ITC data for (dT)8 (A) and (dU)8 (B) binding to NS3h. Experiments were performed in 25 mM MOPS pH 7.0, 30 mM NaCl, 5 mM MgCl2, 1 mM TCEP, 1% Glycerol buffer at 25 °C. The upper panels show the raw ITC data for oligonucleotides titrated into protein, and buffer (y-axis offset). The lower panels show the integrated areas for each injection, where the solid squares represent oligonucleotide binding to protein, and the open circles represent the control experiment of oligonucleotide titrated into buffer. The solid line represents the fit to an N independent and identical binding sites model binding model, with N~1.
Scheme 1
Scheme 1
Scheme 2
Scheme 2
Scheme A1
Scheme A1
Scheme A2
Scheme A2
Scheme A3
Scheme A3

Similar articles

Cited by

References

    1. LOHMAN TM, BJORNSON KP. MECHANISMS OF HELICASE-CATALYZED DNA UNWINDING. ANNU REV BIOCHEM. 1996;65:169–214. - PubMed
    1. LOHMAN TM, TOMKO EJ, WU CG. NON-HEXAMERIC DNA HELICASES AND TRANSLOCASES: MECHANISMS AND REGULATION. NAT REV MOL CELL BIOL. 2008;9:391–401. - PubMed
    1. PATEL SS, DONMEZ I. MECHANISMS OF HELICASES. J BIOL CHEM. 2006;281:18265–8. - PubMed
    1. PYLE AM. TRANSLOCATION AND UNWINDING MECHANISMS OF RNA AND DNA HELICASES. ANNU REV BIOPHYS. 2008;37:317–36. - PubMed
    1. SINGLETON MR, DILLINGHAM MS, WIGLEY DB. STRUCTURE AND MECHANISM OF HELICASES AND NUCLEIC ACID TRANSLOCASES. ANNU REV BIOCHEM. 2007;76:23–50. - PubMed

Publication types