Comparative Study
. 2010 Jun 30;190(1):80-91.
doi: 10.1016/j.jneumeth.2010.04.028. Epub 2010 May 6.

A continuous measure of phasic electrodermal activity

Affiliations
Comparative Study

A continuous measure of phasic electrodermal activity

Mathias Benedek et al. J Neurosci Methods. .

Abstract

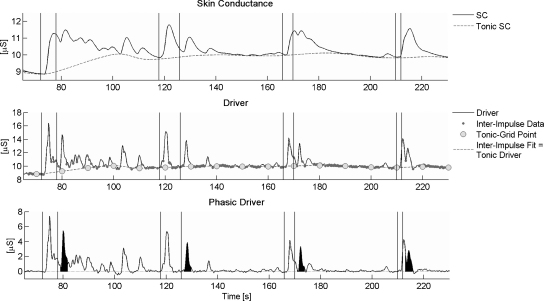
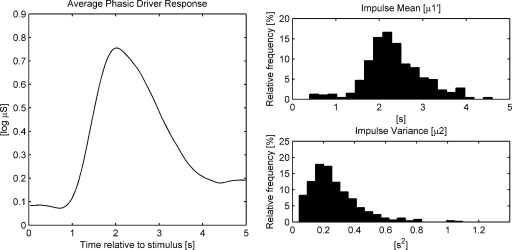
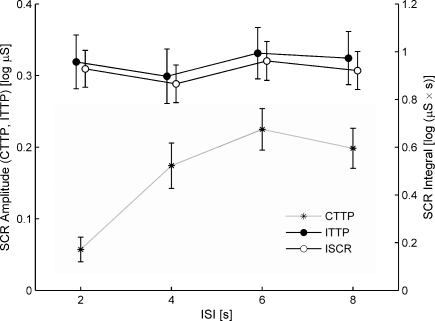
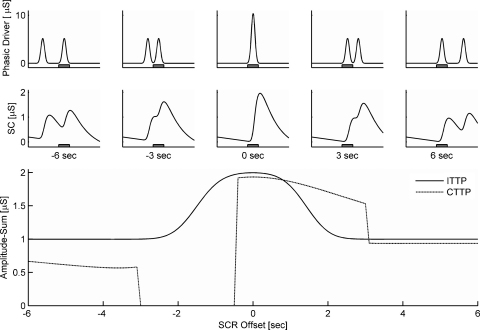
Electrodermal activity is characterized by the superposition of what appear to be single distinct skin conductance responses (SCRs). Classic trough-to-peak analysis of these responses is impeded by their apparent superposition. A deconvolution approach is proposed, which separates SC data into continuous signals of tonic and phasic activity. The resulting phasic activity shows a zero baseline, and overlapping SCRs are represented by predominantly distinct, compact impulses showing an average duration of less than 2 s. A time integration of the continuous measure of phasic activity is proposed as a straightforward indicator of event-related sympathetic activity. The quality and benefit of the proposed measure is demonstrated in an experiment with short interstimulus intervals as well as by means of a simulation study. The advances compared to previous decomposition methods are discussed.


Figures

Fig. 1
Fig. 1
Phasic driver extraction illustrated for a SC data section of 165 s including four trials with pairs of stimuli realizing ISIs of 6, 8, 4 and 2 s (stimulus times are indicated by vertical lines). The upper row shows the original SC data. The middle row shows the driver signal which results from deconvolution of the SC data. Inter-impulse data are used to estimate the tonic part of the driver at 10-s intervals (tonic grid points). The tonic driver is used to compute the tonic SC (see upper row). Subtraction of the tonic part from the driver results in the phasic driver (lower row). The phasic driver shows a virtually zero baseline and distinct phasic responses. The time integral of the phasic driver for the second stimulus per trial is shaded in black (response window 1–4 s after stimulus onset).
Fig. 2
Fig. 2
Event-related responses to stimulus pairs (trials) with an interstimulus interval of 8, 6, 4 and 2 s are depicted in rows one to four, respectively. On the left side, the averaged phasic driver and the averaged SC data (* after subtraction of the minimum within the respective trial) are displayed for the respective ISI condition. On the right side, the 50 most powerful responses are depicted for each ISI condition. Stimulus onset latencies are indicated by vertical lines.
Fig. 3
Fig. 3
Event-related average phasic driver response for 0–5 s after stimulus onset (averaged over all stimuli of trials with ISIs of 6 or 8 s; left side), and distribution of mean (μ1) and variance (μ2) of the underlying single phasic driver responses (N = 576; right side).
Fig. 4
Fig. 4
The effect of different ISIs ranging from 2 to 8 s on the magnitude of the SCR amplitude for classic trough-to-peak (CTTP) as compared to the improved trough-to-peak (ITTP), and compared to the integrated skin conductance response (ISCR). Note, that ISCR uses different units and scaling as indicated by the ordinate on the right side.
Fig. 5
Fig. 5
Simulation of the amplitude of a fixed SCR, which becomes biased by a second SCR with an offset varying from −6 to +6 s. The phasic driver (first row) and SC data (second row) are displayed for −6, 3, 0, +3, and +6 s; the gray box represents the response window. The resulting amplitude-sum for SCRs within the response window is depicted dependent on the SCR offset for the classic trough-to-peak method (CTTP) and for the improved trough-to-peak method (ITTP) after phasic driver extraction (lower part of figure).

References

    1. Alexander D.M., Trengove C., Johnston P., Cooper T., August J.P., Gordon E. Separating individual skin conductance responses in a short interstimulus-interval paradigm. J Neurosci Meth. 2005;146:116–123. - PubMed
    1. Bach D.R., Flandin G., Friston K.J., Dolan R.J. Time-series analysis for rapid event-related skin conductance responses. J Neurosci Meth. 2009;184(2):224–234. - PMC - PubMed
    1. Baltissen R., Schaefer F., Kimmel H.D. Der Einfluß von zeitlicher Verteilung bei konstanter Häufigkeit der Reize auf die Habituation der Orientierungsreaktion. [The influence of temporal dispersion at constant frequency of stimuli on habituation of the orienting response] Z Exp Angew Psychol. 1989;36(2):181–198. - PubMed
    1. Benedek M., Kaernbach C. Decomposition of skin conductance data by means of nonnegative deconvolution. Psychophysiology. 2010 - PMC - PubMed
    1. Bini G., Hagebarth K.-E., Hynninen P., Wallin B.G. Thermoregulatory and rhythm-generating mechanisms governing the sudomotor and vasoconstrictor outflow in human cutaneous nerves. J Physiol. 1980;306:537–552. - PMC - PubMed

Publication types

LinkOut - more resources