. 2010 Jul 5;28(30):4827-36.
doi: 10.1016/j.vaccine.2010.04.064. Epub 2010 May 6.

Long-lasting humoral and cellular immune responses and mucosal dissemination after intramuscular DNA immunization

Affiliations

Long-lasting humoral and cellular immune responses and mucosal dissemination after intramuscular DNA immunization

Vainav Patel et al. Vaccine. .

Abstract

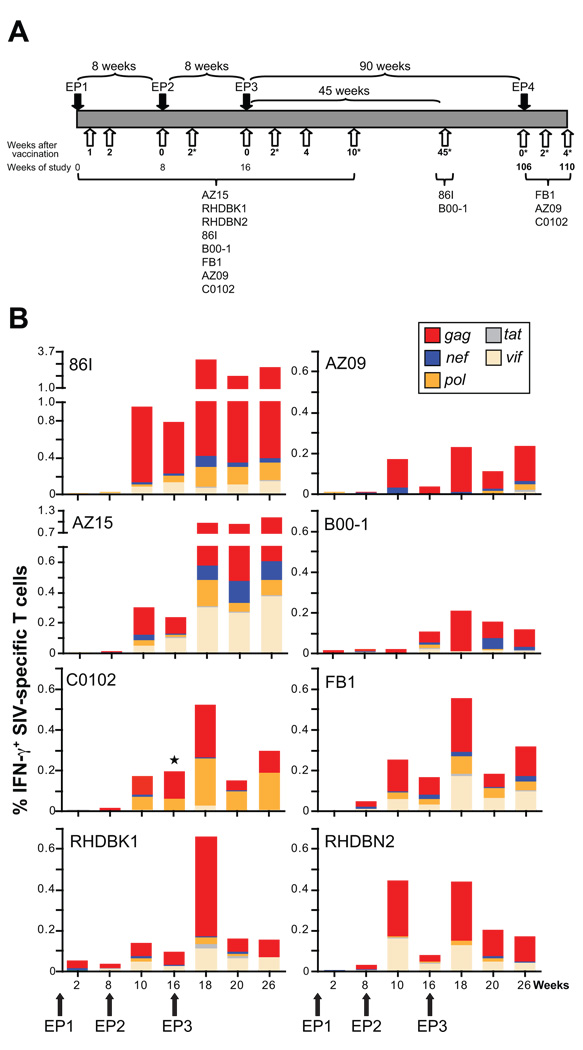
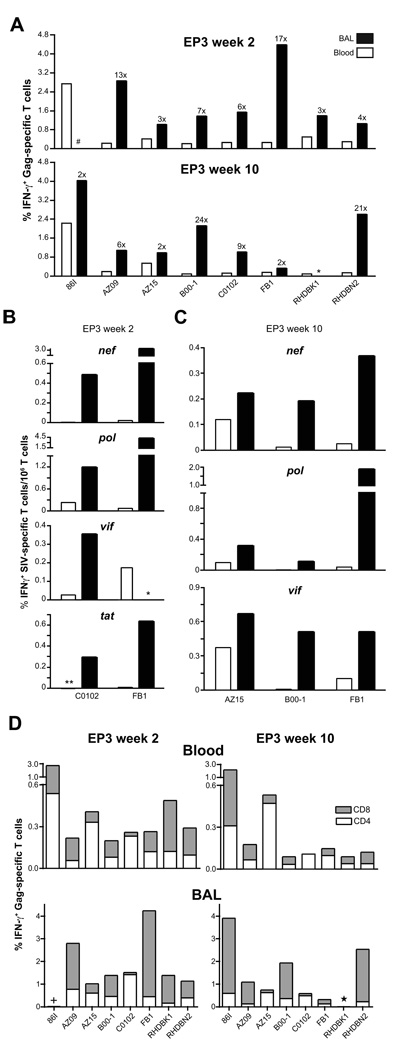
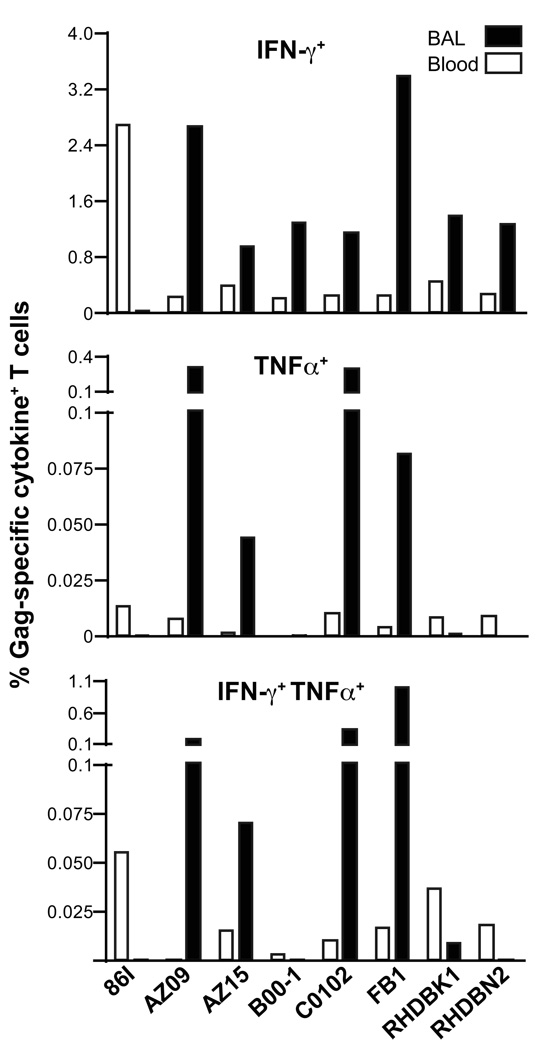
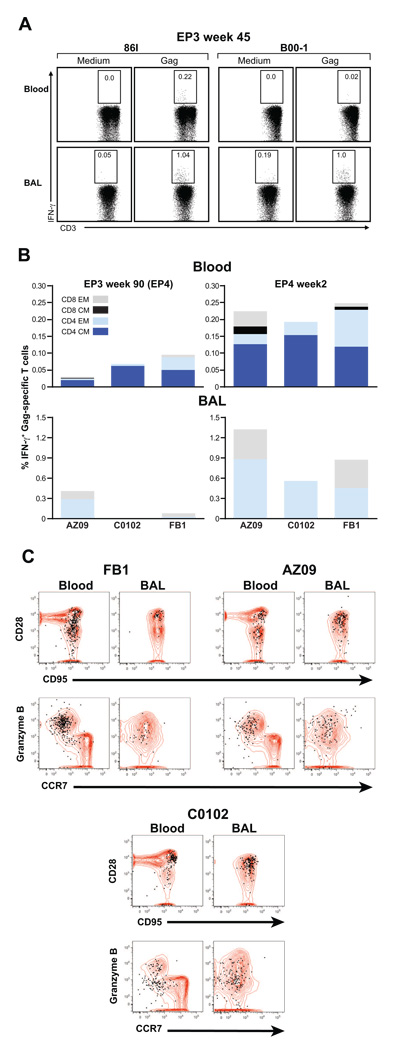
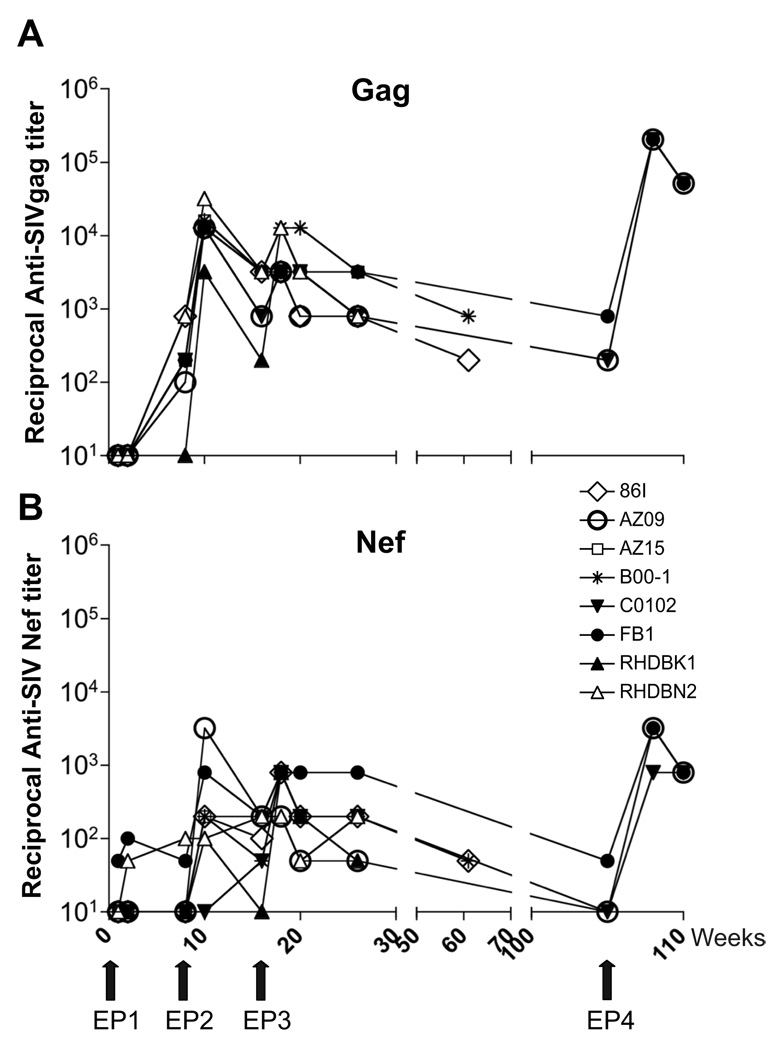
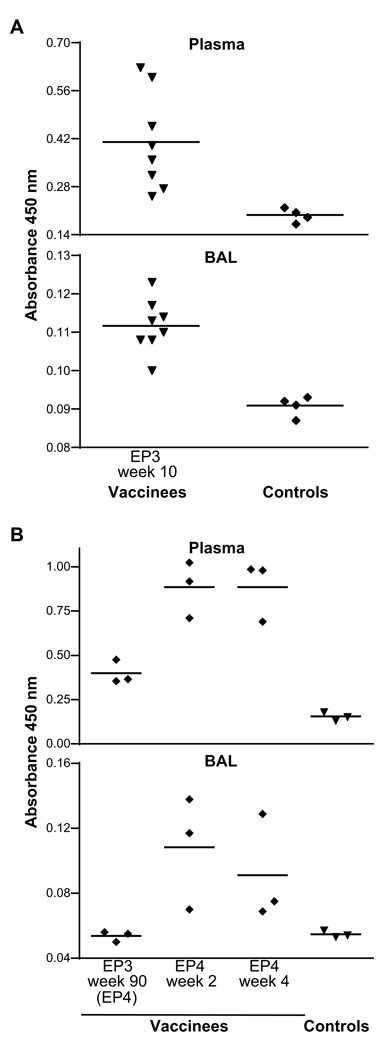
Naïve Indian rhesus macaques were immunized with a mixture of optimized plasmid DNAs expressing several SIV antigens using in vivo electroporation via the intramuscular route. The animals were monitored for the development of SIV-specific systemic (blood) and mucosal (bronchoalveolar lavage) cellular and humoral immune responses. The immune responses were of great magnitude, broad (Gag, Pol, Nef, Tat and Vif), long-lasting (up to 90 weeks post third vaccination) and were boosted with each subsequent immunization, even after an extended 90-week rest period. The SIV-specific cellular immune responses were consistently more abundant in bronchoalveolar lavage (BAL) than in blood, and were characterized as predominantly effector memory CD4(+) and CD8(+) T cells in BAL and as both central and effector memory T cells in blood. SIV-specific T cells containing Granzyme B were readily detected in both blood and BAL, suggesting the presence of effector cells with cytolytic potential. DNA vaccination also elicited long-lasting systemic and mucosal humoral immune responses, including the induction of Gag-specific IgA. The combination of optimized DNA vectors and improved intramuscular delivery by in vivo electroporation has the potential to elicit both cellular and humoral responses and dissemination to the periphery, and thus to improve DNA immunization efficacy.


Figures

Fig. 1
Fig. 1
DNA vaccination induces SIV-specific responses. (A) Outline of study. Indian rhesus macaques were vaccinated using in vivo DNA electroporation three times (EP1, EP2, EP3) at weeks 0, 8 and 16. Some of the animals were subjected to a 4th vaccination (EP4) at week 106. The animals were monitored for cellular and humoral immune responses in blood (open arrows) and BAL (indicated by *). All animals were monitored up to week 26 post EP3. Two animals were also evaluated at week 61 (45 weeks post EP3) and 3 animals were evaluated at week 106 (90 weeks post EP3) at which point they received EP4. (B) Frequency and distribution of SIV-specific IFN-γ+ T cells in blood. The antigen-specific IFN-γ production for all 8 animals was obtained by measuring the frequency of IFN-γ+ T cells obtained upon incubation with the indicated peptide pools. ⋆, vif responses for animal C0102 were not determined at week 16 due to limited sample availability. Note that different scales were used for the different animals.
Fig. 2
Fig. 2
Induction of cellular and mucosal immune responses. (A) The frequency of SIV Gag-specific IFN-γ producing T cells in BAL (filled bars) and blood (open bars) at weeks 2 and 10 post EP3 is shown. The numbers indicate the fold increases in BAL compared to blood. *, BAL sample not available for RHDBK1 at week 10 post EP3. #, animal 86I had very low Gag responses at week 2 post EP3. (B) Cellular immune responses to other antigens. Comparison of the frequency of SIV (nef, pol, vif and tat)-specific IFN-γ producing T cells in BAL (filled bars) and blood (open bars) for animals C0102 and FB1 at week 2 post EP3. *, no Vif responses were measured in BAL from animal FB1 due to insufficient cell availability. **, Tat responses in blood for animal C0102 not detected. (C) Frequency of SIV (nef, pol, and vif)-specific IFN-γ producing T cells in BAL (filled bars) and blood (open bars) at week 10 post EP3 for animals AZ15, B00-1, and FB1. (D) Frequency and distribution of Gag-specific IFN-γ+ T cell subsets in blood and BAL at weeks 2 and 10 post EP3. Gag-specific T cells CD4+ (white bars) and CD8+ (grey bars) are plotted. *, BAL not available for RHDBK1. +, very low Gag responses for animal 86I at week 2 post EP3 in BAL.
Fig. 3
Fig. 3
SIV-specific responses in blood and BAL. T cells isolated from blood and BAL were analyzed by polychromatic flow cytometry for the production of IFN-γ and TNFα only or the combination thereof upon stimulation with the SIV Gag peptide pool. Note the different scales for the plots. Data shown is for EP3week2.
Fig. 4
Fig. 4
SIV-specific responses in blood and BAL are long lasting and can be boosted after a ~2 years rest period. (A) Detection of SIV Gag-specific T cells in blood and BAL in animals 86I (left) and B00-1 (right) at week 45 post EP3. The frequency of the SIV Gag-specific IFN-γ+ T cells in blood (upper panel) and BAL (lower panel) are shown. (B) Frequency and distribution of Gag-specific IFN-γ+ T cell subsets (CD4+ and CD8+ effector (EM) and central memory (CM) cells) in blood and BAL of AZ09, C0102, and FB1 at 90 weeks post EP3 (EP4) (left panel). Induction of cellular immune responses in blood and BAL upon EP4 were measured 2 weeks later (right panel). Note that different scales were used for the analysis of blood and BAL. (C) The plots show overlays of the total T cell population (red contours) in blood and BAL with the Gag-specific cells as measured by IFN-γ production upon peptide stimulation (black dots). The cells were analyzed for memory markers (CD28, CD95, upper panel). The naïve population, defined by CD28+ CD95low / negative, does not contain any IFN-γ+ cells and is absent in BAL. The functionality of the Gag-specific CCR7 memory cell population (lower panel) was assessed by testing for their ability to produce Granzyme B as shown for animals FB1, AZ09, C0102.
Fig. 5
Fig. 5
DNA vaccination induced significant SIV-specific humoral responses. Anti-SIV-Gag (A) and anti-SIV-Nef (B) antibody titers were measured in plasma and the end-point dilution titers at indicated time points are shown for all animals. Animals 86I and B00-1 were available for analysis up to week 45 post EP3. Animals FB1, AZ09, C0102 were available at week 90 post EP3, at which time point they were subjected to a fourth DNA Electroporation (EP4). End-point dilutions were obtained upon testing serial dilutions of the plasma samples starting at EP1 week 1. Titers are reported as the reciprocal of the highest positive dilution.
Fig. 6
Fig. 6
Measurements of Gag-specific IgA in plasma and BAL by ELISA. (A) Analysis 10 weeks following EP3 in plasma and BAL washes. The difference between vaccinees and controls is significant (p=0.0041; t test). Mean absorbance values of SIV Gag-specific IgA are shown for all 8 vaccinated animals and 4 naïve controls. (B) Analysis 90 weeks after EP3 (day of EP4) as well as 2 and 4 weeks post EP4 for three vaccinated macaques compared to three naïve controls.

Similar articles

Cited by

References

    1. Haynes BF, Shattock RJ. Critical issues in mucosal immunity for HIV-1 vaccine development. J Allergy Clin Immunol. 2008 Jul;122(1):3–9. quiz 10-1. - PMC - PubMed
    1. Paiardini M, Frank I, Pandrea I, Apetrei C, Silvestri G. Mucosal immune dysfunction in AIDS pathogenesis. AIDS Rev. 2008 Jan–Mar;10(1):36–46. - PubMed
    1. Belyakov IM, Berzofsky JA. Immunobiology of mucosal HIV infection and the basis for development of a new generation of mucosal AIDS vaccines. Immunity. 2004 Mar;20(3):247–253. - PubMed
    1. Kutzler MA, Weiner DB. DNA vaccines: ready for prime time? Nat Rev Genet. 2008 Oct;9(10):776–788. - PMC - PubMed
    1. Yuki Y, Nochi T, Kiyono H. Progress towards an AIDS mucosal vaccine: an overview. Tuberculosis (Edinb) 2007 Aug;87 Suppl 1:S35–S44. - PubMed

Publication types

MeSH terms