

Evolution and recombination of genes encoding HIV-1 drug resistance and tropism during antiretroviral therapy
- PMID: 20451945
- PMCID: PMC3186207
- DOI: 10.1016/j.virol.2010.04.008
Evolution and recombination of genes encoding HIV-1 drug resistance and tropism during antiretroviral therapy
Abstract
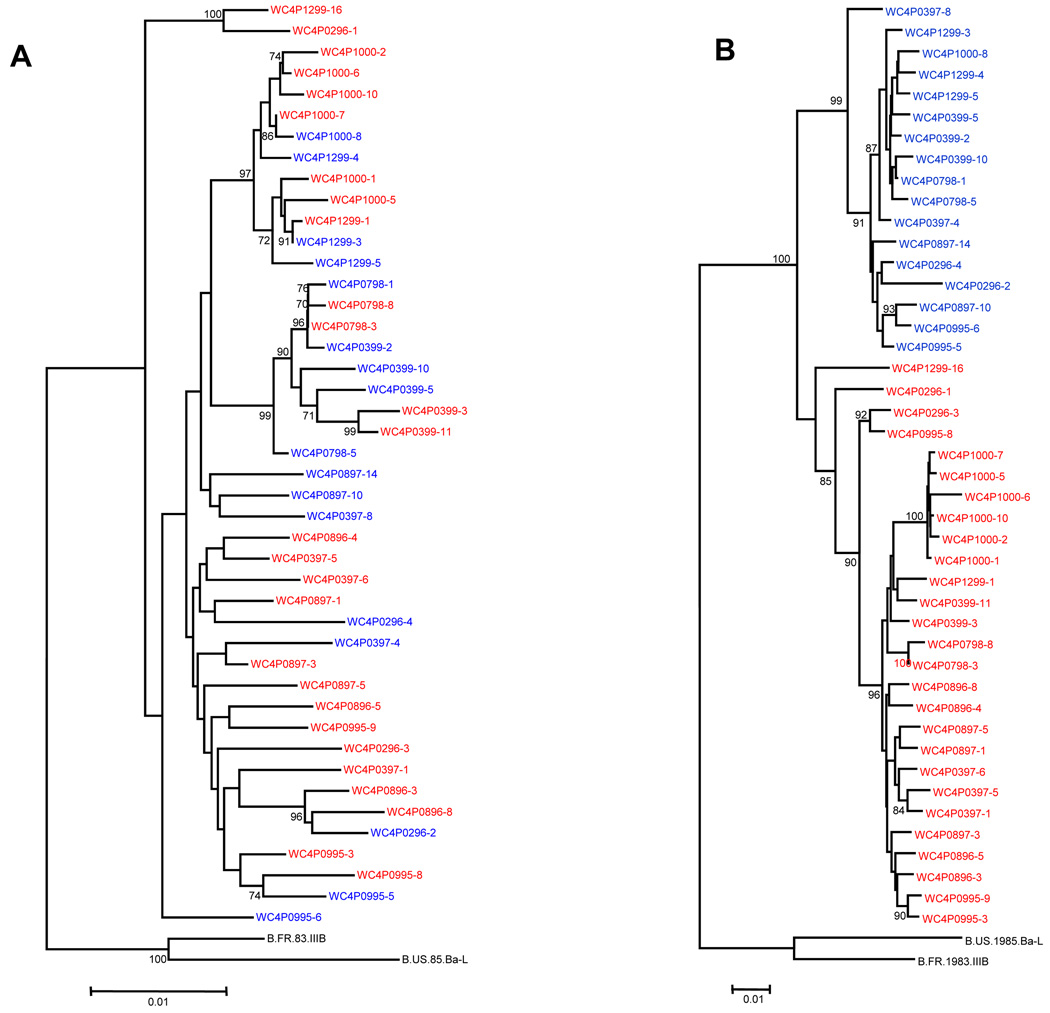
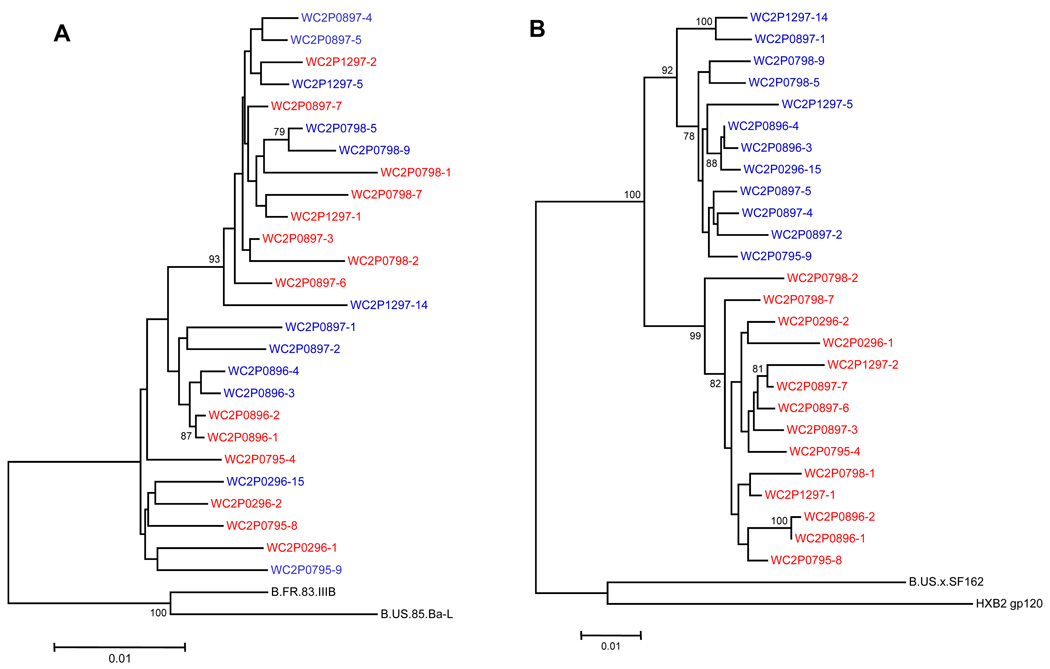
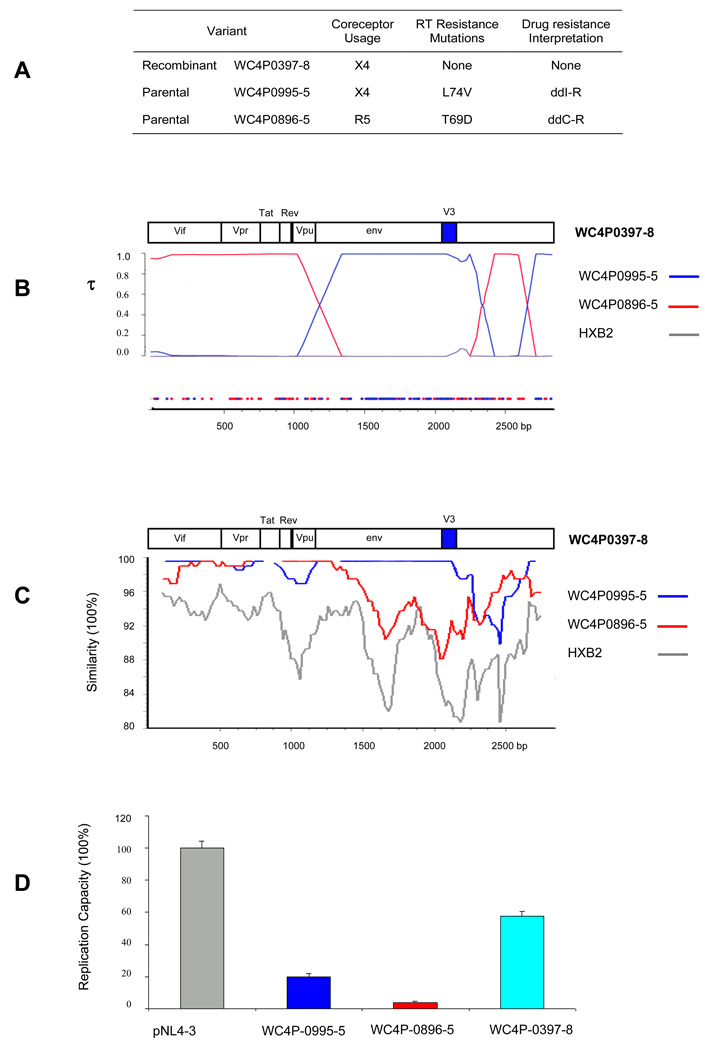
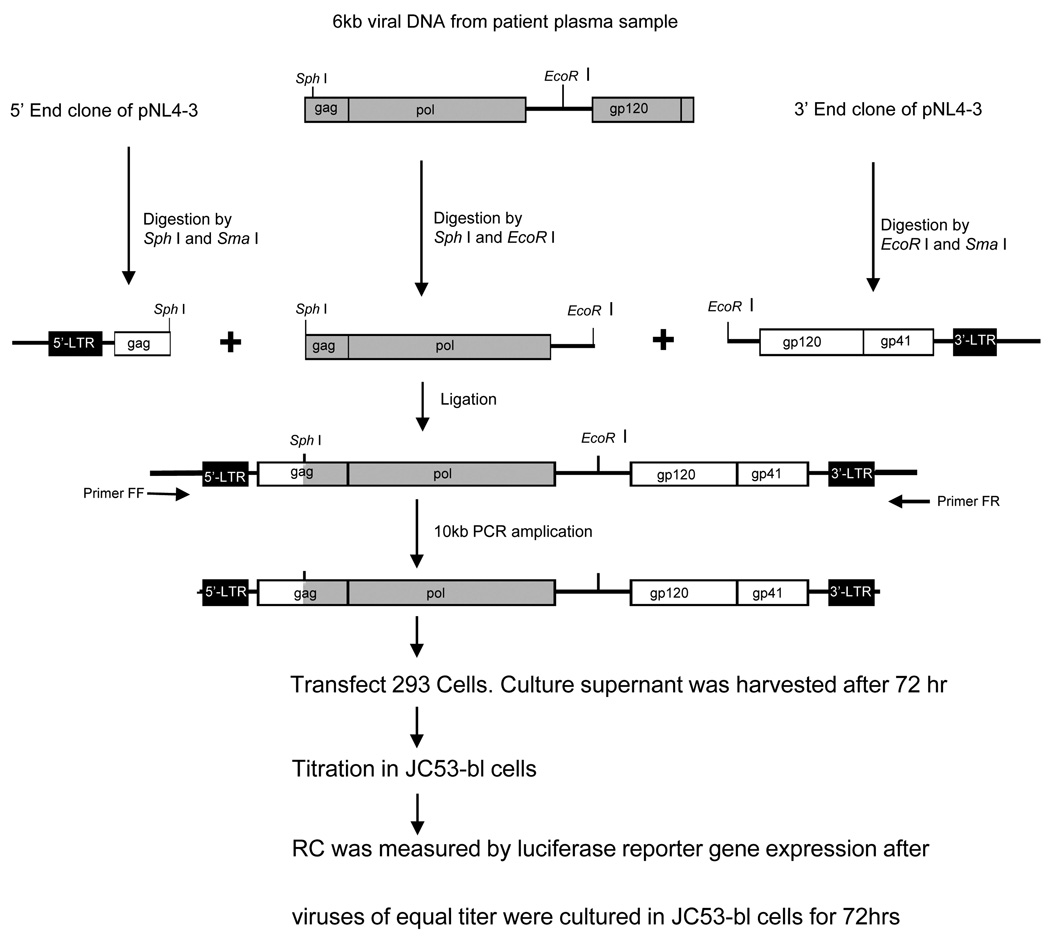
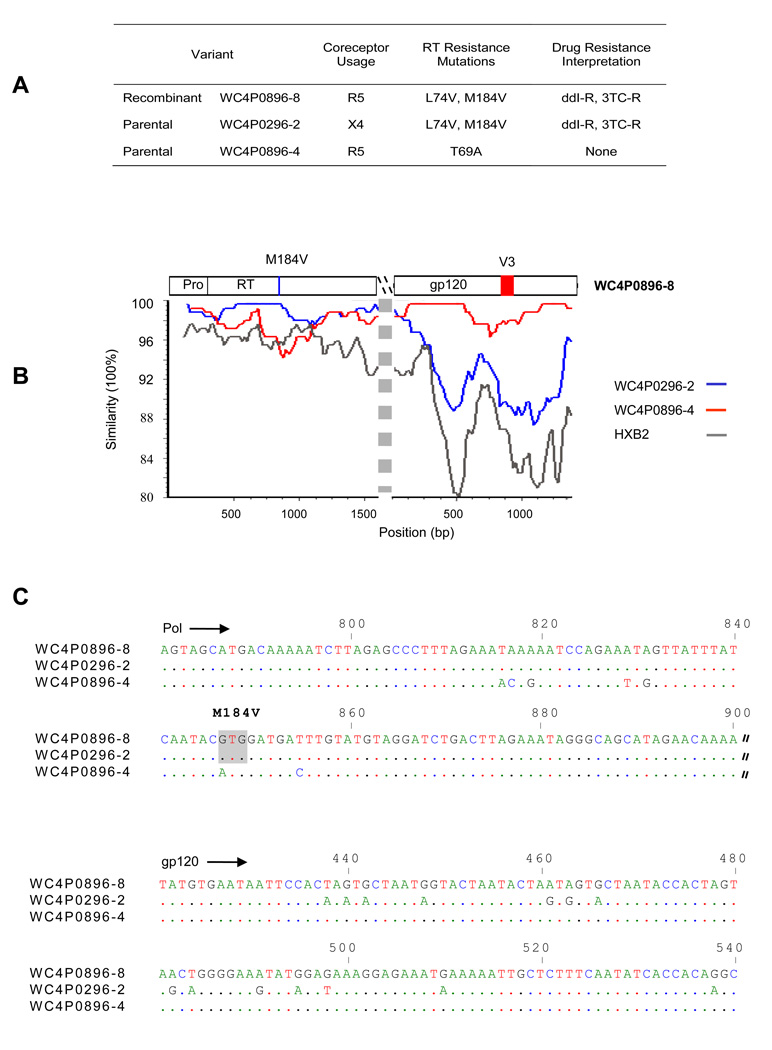
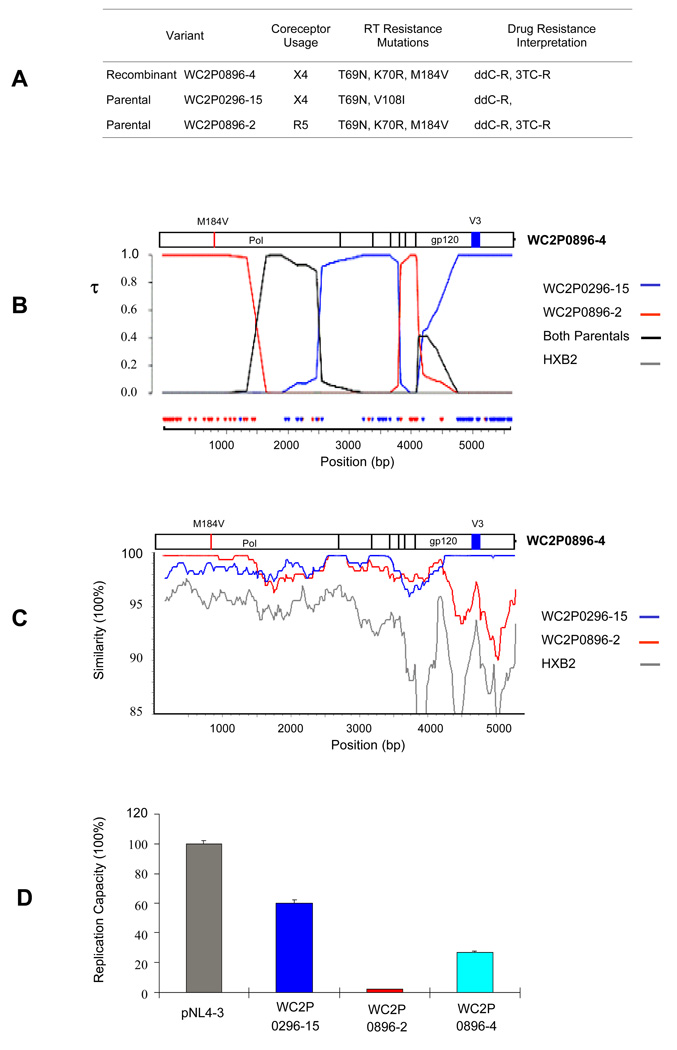
Characterization of residual plasma virus during antiretroviral therapy (ART) is a high priority to improve understanding of HIV-1 pathogenesis and therapy. To understand the evolution of HIV-1 pol and env genes in viremic patients under selective pressure of ART, we performed longitudinal analyses of plasma-derived pol and env sequences from single HIV-1 genomes. We tested the hypotheses that drug resistance in pol was unrelated to changes in coreceptor usage (tropism), and that recombination played a role in evolution of viral strains. Recombinants were identified by using Bayesian and other computational methods. High-level genotypic resistance was seen in approximately 70% of X4 and R5 strains during ART. There was no significant association between resistance and tropism. Each patient displayed at least one recombinant encompassing env and representing a change in predicted tropism. These data suggest that, in addition to mutation, recombination can play a significant role in shaping HIV-1 evolution.
Copyright 2010 Elsevier Inc. All rights reserved.
Figures
References
-
- Anastos K, Gange SJ, Lau B, Weiser B, Detels R, Giorgi JV, Margolick JB, Cohen M, Phair J, Melnick S, Rinaldo CR, Kovacs A, Levine A, Landesman S, Young M, Muñoz A, Greenblatt RM. Association of race and gender with HIV-1 RNA levels and immunologic progression. J Acquir Immune Defic Syndr. 2000;24:218–226. - PubMed
-
- Barbour JD, Wrin T, Grant RM, Martin JN, Segal MR, Petropoulos CJ, Deeks S. Evolution of phenotypic drug susceptibility and viral replication capacity during long-term virologic failure of protease inhibitor therapy in human immunodeficiency virus-infected adults. J Virol. 2002;76:11104–11112. - PMC - PubMed
-
- Bhattacharyya D, Brooks BR, Callahan L. Positioning of positively charged residues in the V3 loop correlates with HIV type 1 syncytium-inducing phenotype. AIDS Res Hum Retroviruses. 1996;12:83–90. - PubMed
Publication types
MeSH terms
Substances
Associated data
- Actions
- Actions
- Actions
- Actions
- Actions
- Actions
- Actions
- Actions
- Actions
- Actions
- Actions
- Actions
- Actions
- Actions
- Actions
- Actions
- Actions
- Actions
- Actions
- Actions
- Actions
- Actions
- Actions
- Actions
- Actions
- Actions
- Actions
- Actions
- Actions
- Actions
- Actions
- Actions
- Actions
- Actions
- Actions
- Actions
- Actions
- Actions
- Actions
- Actions
- Actions
- Actions
- Actions
- Actions
- Actions
- Actions
- Actions
- Actions
- Actions
- Actions
- Actions
- Actions
- Actions
- Actions
- Actions
- Actions
- Actions
- Actions
- Actions
- Actions
- Actions
- Actions
- Actions
- Actions
- Actions
- Actions
- Actions
- Actions
- Actions
- Actions
- Actions
- Actions
- Actions
- Actions
- Actions
- Actions
- Actions
- Actions
- Actions
- Actions
- Actions
- Actions
- Actions
- Actions
- Actions
- Actions
- Actions
- Actions
- Actions
- Actions
- Actions
- Actions
- Actions
- Actions
- Actions
- Actions
- Actions
- Actions
- Actions
- Actions
- Actions
- Actions
- Actions
- Actions
- Actions
- Actions
- Actions
- Actions
- Actions
- Actions
- Actions
- Actions
- Actions
- Actions
- Actions
- Actions
- Actions
- Actions
- Actions
- Actions
- Actions
- Actions
- Actions
- Actions
- Actions
- Actions
- Actions
- Actions
- Actions
- Actions
- Actions
- Actions
- Actions
- Actions
- Actions
- Actions
- Actions
- Actions
- Actions
- Actions
- Actions
- Actions
- Actions
- Actions
- Actions
- Actions
- Actions
- Actions
- Actions
- Actions
- Actions
- Actions
- Actions
- Actions
- Actions
- Actions
- Actions
- Actions
- Actions
- Actions
- Actions
- Actions
- Actions
- Actions
- Actions
- Actions
- Actions
- Actions
- Actions
- Actions
- Actions
- Actions
- Actions
- Actions
- Actions
- Actions
- Actions
- Actions
- Actions
- Actions
- Actions
- Actions
- Actions
- Actions
- Actions
- Actions
- Actions
- Actions
- Actions
- Actions
- Actions
- Actions
- Actions
- Actions
- Actions
- Actions
- Actions
- Actions
- Actions
- Actions
- Actions
- Actions
- Actions
- Actions
- Actions
- Actions
- Actions
- Actions
- Actions
- Actions
- Actions
- Actions
- Actions
- Actions
- Actions
- Actions
- Actions
- Actions
- Actions
- Actions
- Actions
- Actions
- Actions
- Actions
- Actions
- Actions
- Actions
- Actions
- Actions
- Actions
- Actions
- Actions
- Actions
- Actions
- Actions
- Actions
- Actions
- Actions
- Actions
- Actions
- Actions
- Actions
- Actions
- Actions
- Actions
- Actions
- Actions
- Actions
- Actions
- Actions
- Actions
- Actions
- Actions
- Actions
- Actions
- Actions
- Actions
- Actions
- Actions
Grants and funding
LinkOut - more resources
Full Text Sources
Medical
Molecular Biology Databases
