. 2010 Jul;205(1):86-92.
doi: 10.1016/j.jmr.2010.04.007. Epub 2010 Apr 18.

Investigation of the dynamical properties of water in elastin by deuterium Double Quantum Filtered NMR

Affiliations

Investigation of the dynamical properties of water in elastin by deuterium Double Quantum Filtered NMR

Cheng Sun et al. J Magn Reson. 2010 Jul.

Erratum in

  • J Magn Reson. 2012 Mar;216:213

Abstract

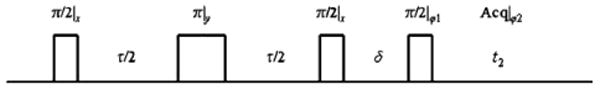
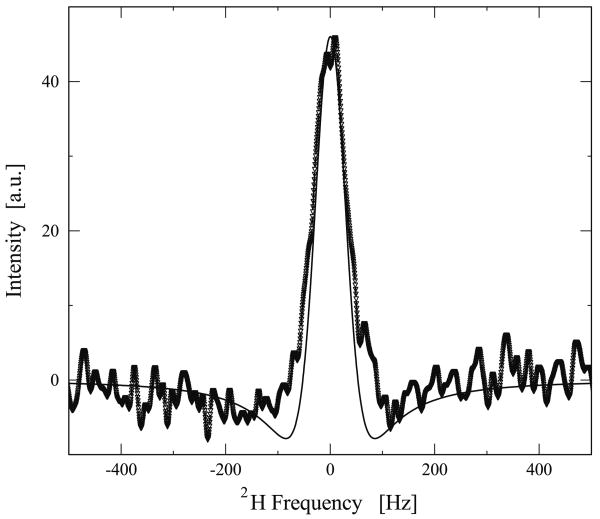
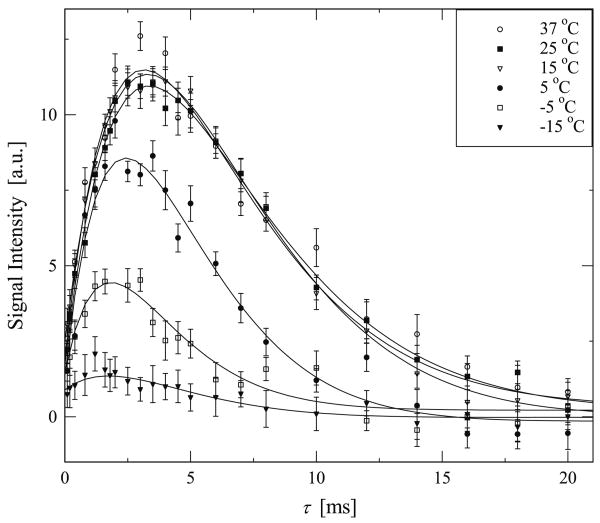
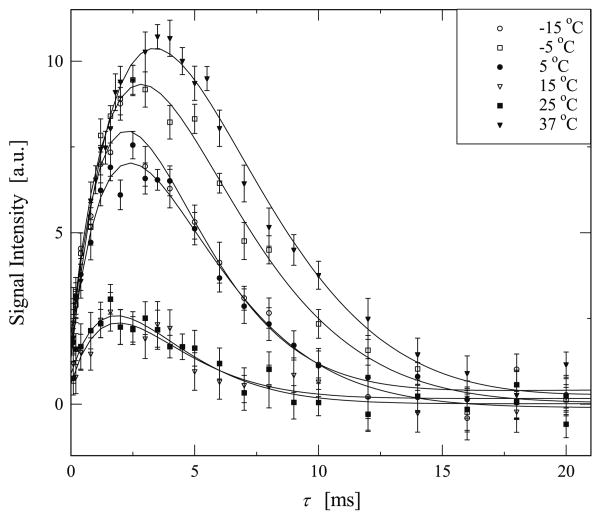
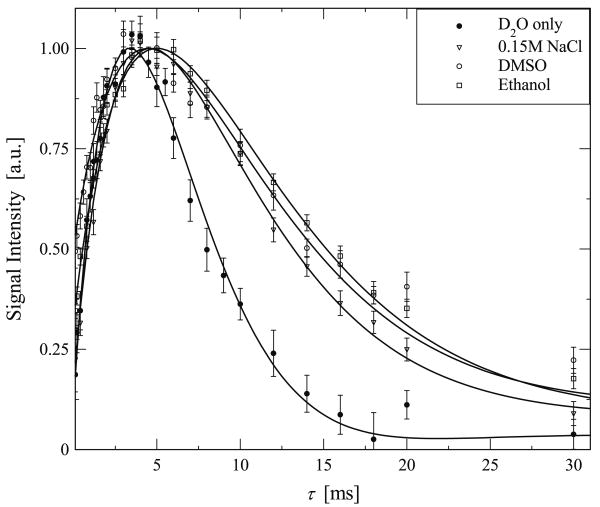
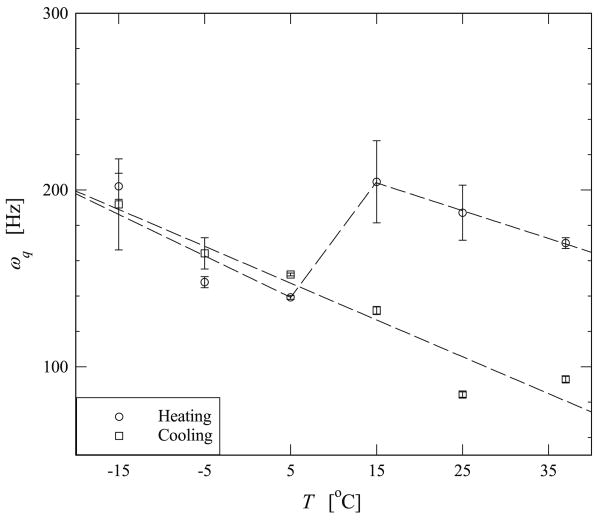
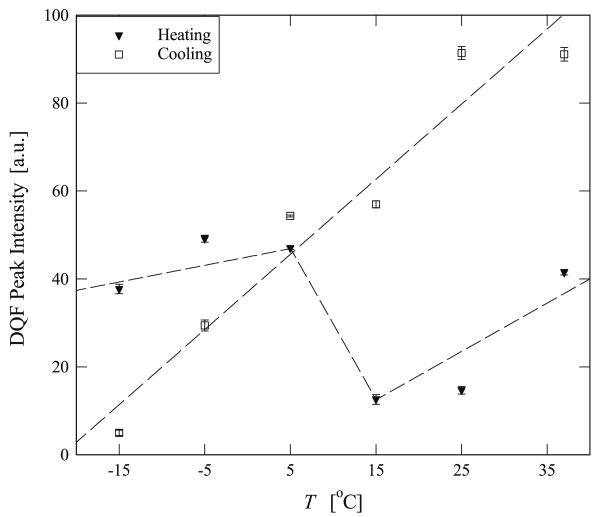
The anisotropic motion of tightly bound waters of hydration in bovine nuchal ligament elastin has been studied by deuterium Double Quantum Filtered (DQF) NMR. The experiments have allowed for a direct measurement of the degree of anisotropy within pores of elastin over a time scale ranging from 100 micros to 30 ms, corresponding to a tortuous spatial displacement ranging from 0.2 to 7 microm. We studied the anisotropic motion of deuterium nuclei in D2O hydrated elastin over a temperature of -15 degrees C to 37 degrees C and in solvents with varying dielectric constants. Our experimental measurements of the residual quadrupolar interaction as a function of temperature are correlated to the existing notion of hydrophobic collapse near 20 degrees C.


Figures

Fig. 1
Fig. 1
RF pulse sequence for generating and detecting double quantum coherence used in this work. In the experiments the phases were ϕ1 = x,y,−x,−y and the acquisition phase ϕ2 = x,−y,−x,y. The phase cycle can be shown to only select double quantum coherence while suppressing zero and single quantum coherences [23,29].
Fig. 2
Fig. 2
Experimental DQF spectrum from D2O hydrated elastin at 37 °C with τ set to 3.5 ms and δ set to 15 μs. Superimposed on the spectra is a simulation where ωq was taken to be 170 Hz, and T2 was set to 4 ms. In both simulation and experimental spectra, a Gaussian line broadening of 5 Hz was applied.
Fig. 3
Fig. 3
Experimental DQF data from D2O hydrated elastin at 25 °C with τ set to 2 ms and δ varied. The data show that the DQF signal oscillates at twice the offset frequency, which was set to 100 Hz, indicating that the signal detected is indeed a double quantum coherence. The solid line represents a theoretically fitted curve as described in the text.
Fig. 4
Fig. 4
Experimental data highlighting the growth and subsequent decay of the DQF signal of deuterated water in elastin. In these experiments the double quantum evolution time δ was set to 15 μs while τ was varied over the range noted on the horizontal axis. The experimental results shown here were collected with the temperature increasing starting from −15 °C. The solid line is a best fit to the experimental data based in Eq. (6).
Fig. 5
Fig. 5
Experimental data highlighting the growth and subsequent decay of the DQF signal of deuterated water in elastin. In these experiments the double quantum evolution time δ was set to 15 μs while τ was varied over the range noted on the horizontal axis. The experimental results shown here were collected with the temperature decreasing, starting from 37 °C. The solid line is a best fit to the experimental data based in Eq. (6).
Fig. 6
Fig. 6
Experimental data highlighting the growth and subsequent decay of the DQF signal of deuterated water in elastin that was saturated in three different solvents, ● D2O only, ∇ 0.15 M NaCl, ○ DMSO, □ Ethanol. The solid line is a best fit to the experimental data based in Eq. (6).
Fig. 7
Fig. 7
Variation of the residual quadrupolar interaction, ωq, with temperature determined by fitting Eq. (6) to the experimental data shown in Figs. 5 and 6. The graph shows the changes observed experimentally when the sample was heated from −15 °C to 37 °C and then subsequently cooled from 37 °C to −15 °C The dashed lines are intended to guide the eye and do not represent or intend to be a fit to the data.
Fig. 8
Fig. 8
Variation of the T2 with temperature determined by fitting Eq. (6) to the experimental data shown in Figs. 5 and 6. The graph shows the changes observed experimentally when the sample was heated from −15 °C to 37 °C and then subsequently cooled from 37 °C to −15 °C. The error bars are within 1% and are omitted for clarity. The dashed line is intended to guide the eye and does not represent or intend to be a fit to the data.
Fig. 9
Fig. 9
Variation of the DQF signal intensity with temperature determined by fitting Eq. (6) to the experimental data shown in Figs. 5 and 6. The graph shows the changes observed experimentally when the sample was heated from −15 °C to 37 °C and then subsequently cooled from 37 °C to −15 °C. The dashed lines are intended to guide the eye and do not represent or intend to be a fit to the data.

Similar articles

Cited by

References

    1. Lillie MA, Gosline JM. The effects of polar solutes on the viscoelastic behavoir of elastin. Biorheology. 1993;30:229–242. - PubMed
    1. Hoeve CAJ, Flory PJ. The elastic properties of elastin. J Am Chem Soc. 1958;80:6523–6526.
    1. Hoeve CAJ, Flory PJ. The elastic properties of elastin. Biopolymers. 1974;23:677–686. - PubMed
    1. Gray WR, Sandberg LB, Foster JA. Molecular model for elastin structure and function. Nature. 1973;246:461–466. - PubMed
    1. Dorrington K, Grut W, McCrum NG. Mechanical state of elastin. Nature. 1975;255:476–478.

Publication types

LinkOut - more resources