. 2010 May 7;6(5):479-91.
doi: 10.1016/j.stem.2010.03.018.

Distinct epigenomic landscapes of pluripotent and lineage-committed human cells

Affiliations

Distinct epigenomic landscapes of pluripotent and lineage-committed human cells

R David Hawkins et al. Cell Stem Cell. .

Abstract

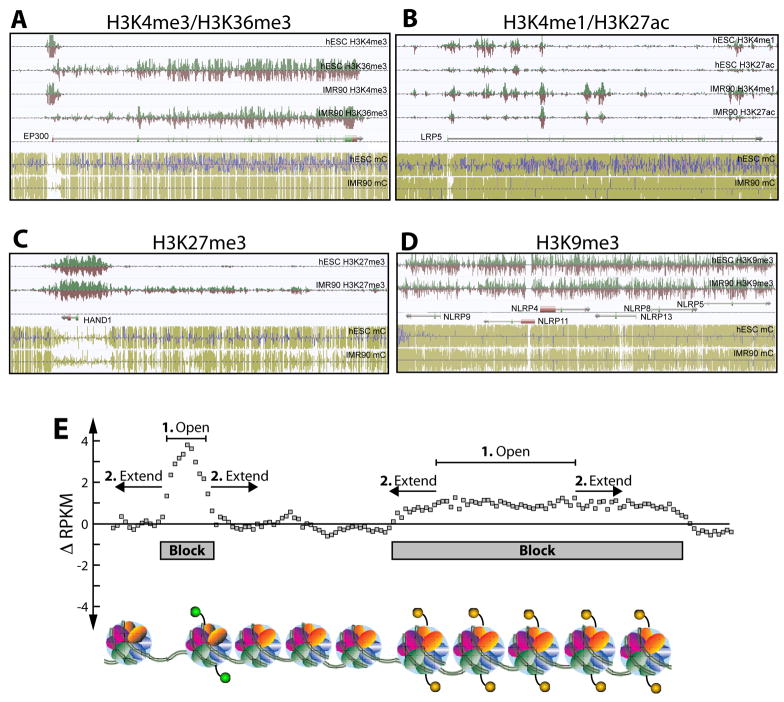
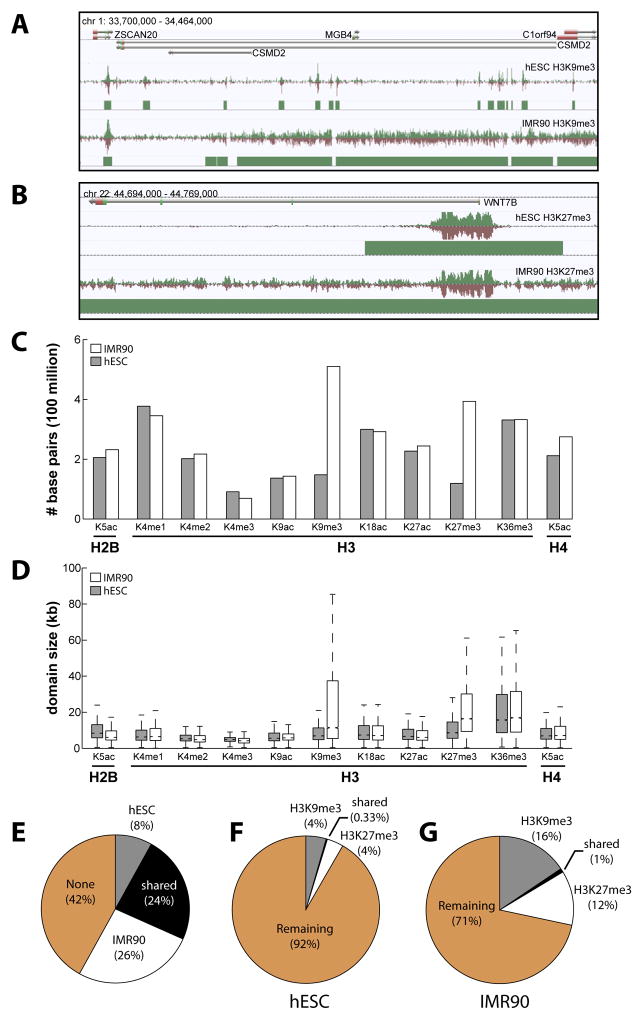
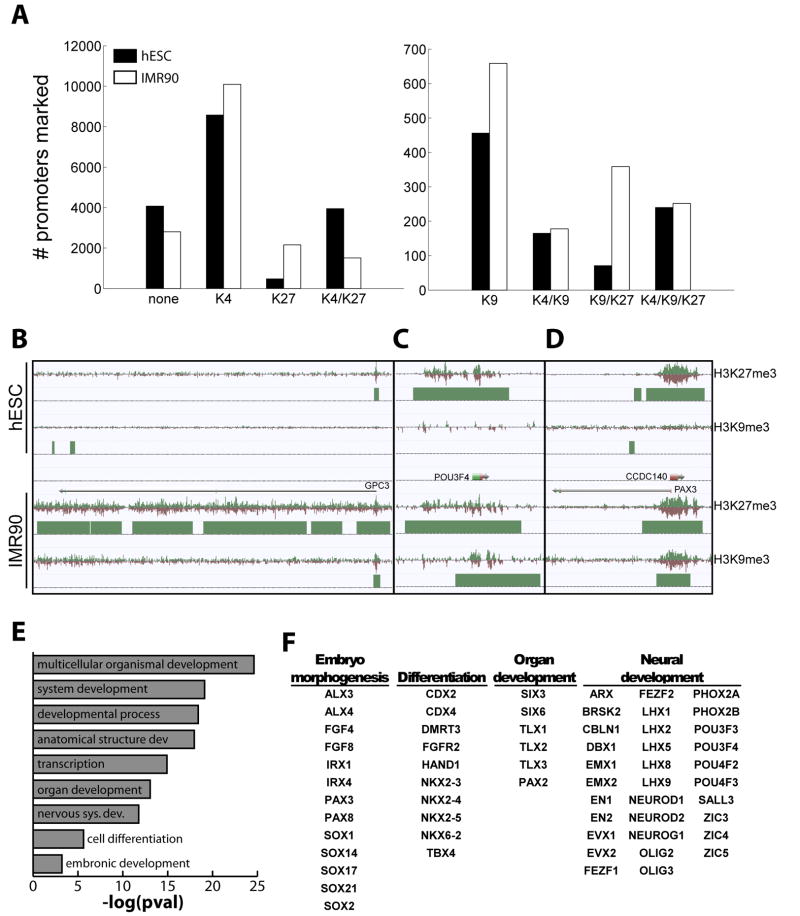
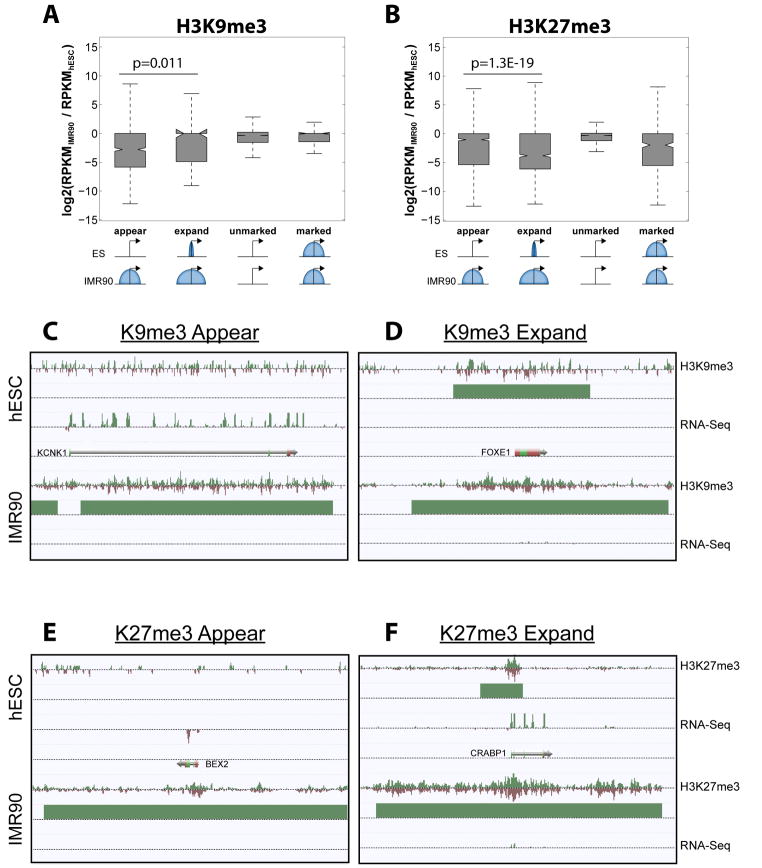
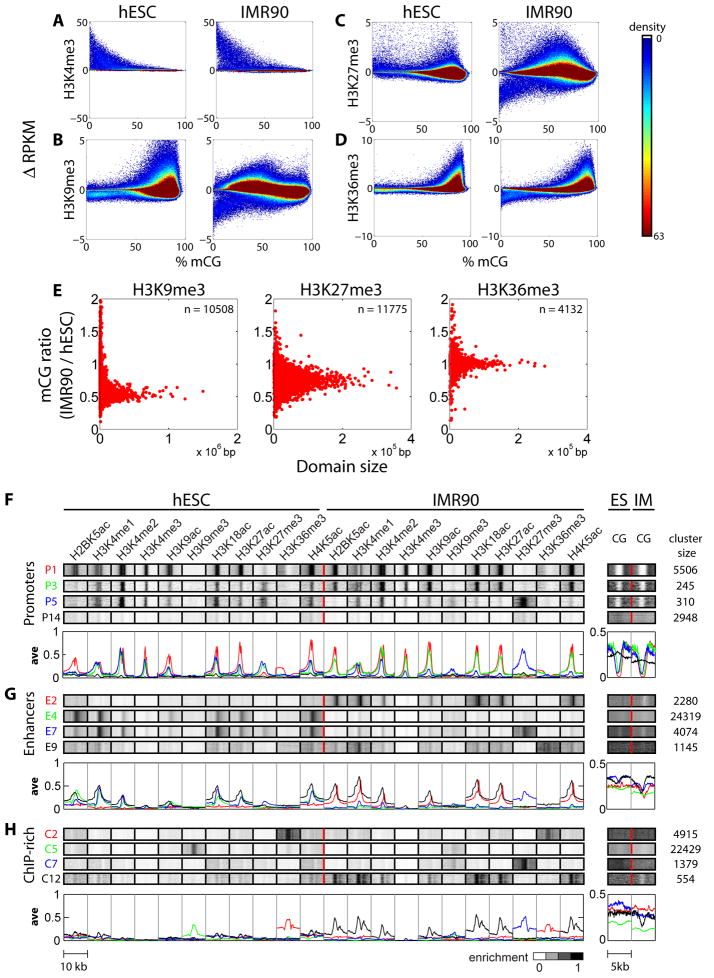
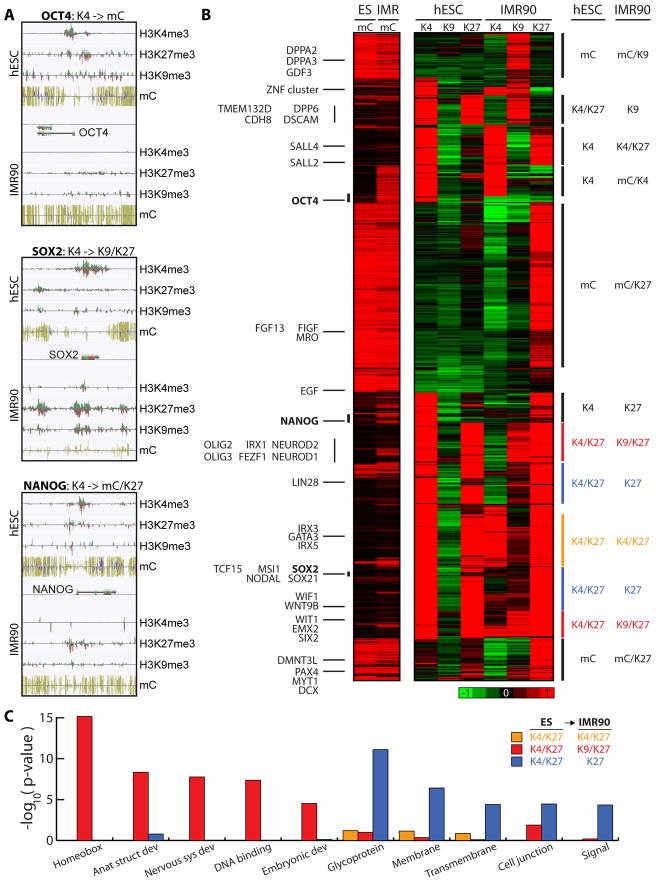
Human embryonic stem cells (hESCs) share an identical genome with lineage-committed cells, yet possess the remarkable properties of self-renewal and pluripotency. The diverse cellular properties in different cells have been attributed to their distinct epigenomes, but how much epigenomes differ remains unclear. Here, we report that epigenomic landscapes in hESCs and lineage-committed cells are drastically different. By comparing the chromatin-modification profiles and DNA methylomes in hESCs and primary fibroblasts, we find that nearly one-third of the genome differs in chromatin structure. Most changes arise from dramatic redistributions of repressive H3K9me3 and H3K27me3 marks, which form blocks that significantly expand in fibroblasts. A large number of potential regulatory sequences also exhibit a high degree of dynamics in chromatin modifications and DNA methylation. Additionally, we observe novel, context-dependent relationships between DNA methylation and chromatin modifications. Our results provide new insights into epigenetic mechanisms underlying properties of pluripotency and cell fate commitment.


Figures

Figure 1
Figure 1. Histone Modifications form Block Structures
(A–D) AnnoJ Browser snapshots of representative examples of the relationship between histone modifications and DNA methylation. Strand-specific mapped tags are displayed above (green) and below the line (red). Strand-specific DNA methylation (mC): mCG (yellow-green bars), mCHG (blue bars), mCHH (pink bars). (A) The p300 (EP300) locus illustrating depleted mCG in the promoter containing H3K4me3, and H3K36me3 in the gene body of both cell types. (B) The NLRP gene cluster is encompassed by H3K9me3 in both cells types, a reduction in mCG is evident in IMR90. (C) H3K27me3 is present at the mCG depleted promoter of the developmental transcription factor HAND1. Spreading of H3K27me3 in IMR90 accounts for correlated differences with mCG. (D) H3K4me1 and H3K27ac occur at both the promoter of LRP5 and distal sites which show differences in mCG. (E) A schematic of the ChromaBlocks strategy for identifying chromatin domains from input-normalized ChIP-Seq data.
Figure 2
Figure 2. Features of Chromatin Domains
(A–B) Examples of (A) H3K9me3 and (B) H3K27me3 domains expanded in IMR90 relative to hESC. (C) The total number of base pairs spanned by domains and (D) the distribution of domain sizes for all mapped chromatin modifications. IMR90, white; hESC, grey (E) The fraction of the human genome spanned by the 11 chromatin modifications profiled in both cell types. The fraction of the (F) hESC and (G) IMR90 genomes spanned by H3K9me3 and H3K27me3 domains.
Figure 3
Figure 3. Expansion of Distinct Chromatin Blocks Marks Developmental Genes
(A) The number of promoters marked by various combinations of chromatin modifications in hESC (black) and IMR90 (white). Exact combinations including H3K4me3, can be found for RefSeq genes in Supplemental Table S7. Abbreviations: K4, H3K4me3; K9, H3K9me3; K27, H3K27me3; none, lacking K4/K9/K27. (B–C) Snapshots of domains and chromatin structure around promoters which gain H3K9me3 and H3K27me3 in IMR90, for (B) GPC3, (C) POU3F4, and (D) PAX3. (E) Gene Ontology - biological processes enriched in promoters that are marked by both H3K9me3 and H3K27me3 in IMR90, along with (F) examples of developmentally relevant genes having this chromatin structure.
Figure 4
Figure 4. Expression of Genes in Different Types of Chromatin Domains
(A) Change in gene expression for promoters where H3K9me3 appears, expands, remains unmarked, or remains similarly marked in IMR90 compared to hESC. (B) As in (A), but for H3K27me3. (C–F) Snapshots of genes exhibiting (C) H3K9me3 appearance, (D) H3K9me3 expansion, (E) H3K27me3 appearance, and (F) H3K27me3 expansion, as observed in IMR90 relative to hESC.
Figure 5
Figure 5. Genome-wide Correlation Analysis between Histone Modifications and Methylated CG (mCG)
(A–D) Change in RPKM for several histone modifications relative to input control were calculated within 2.5kb window for (A) H3K4me3 and 5kb for (B) H3K9me3, (C) H3K27me3, and (D) H3K36me3, and plotted against %mCG in the same window throughout the genome. Density of spots in the plot is displayed by the heatmap (right). (E) For H3K9me3 (left), H3K27me3 (middle), and H3K36me3 (right), spreading chromatin domains were identified as IMR90 domains having at most 20% overlap with hESC domains. Shown is the IMR90 to hESC ratio of %mCG for each of these domains, as a function of domain size. (F–H) Representative Punctuated Chromatin Signatures. ChromaSig was used to simultaneously cluster and align all 11 chromatin modifications mapped from both cell types at (F) promoters, (G) predicted enhancers, and (H) regions of ChIP-Seq enriched sequences. On the left are the chromatin signatures recovered for each cluster, and on the right are %mCG tracks appended after clustering. Enrichment of histone modifications and %mCG are indicated by the heatmap (bottom). The number of genomic loci in each cluster is indicated on the far right. Average profiles for each modification are plotted beneath the representative clustergrams. Profiles are color-coordinated with the cluster ID, e.g. P1 (red), P3 (green), P5 (blue), P14 (black).
Figure 6
Figure 6. Distinct Modes of Epigenetic Repression at Developmental Genes
(A) Snapshots of chromatin modifications and DNA methylation around OCT4, SOX2, and NANOG in hESC and IMR90, illustrating distinct transitions to repressive epigenetic states. Abbreviations: K4, H3K4me3; K9, H3K9me3; K27, H3K27me3; mC, DNA methylation. (B) Unsupervised clustering of H3K4me3, H3K9me3, H3K27me3, and mCG at promoters of genes down-regulated by 2-fold in IMR90 relative hESCs. Relevant genes are indicated to the left. Distinct clusters are noted on the right. The enrichment scale is shown below the heatmap. (C) GO analysis of genes whose promoters remain bivalent (H3K4/K27me3), acquire H3K9me3 (H3K4/K27me3 to H3K9/K27me3), or lose H3K4me3 (H3K4/K27me3 to H3K4me3) in IMR90.
Figure 7
Figure 7. Comparison of repressive chromatin structure in hESC and iPS cells
Overlap of repressive chromatin domains in hESC (blue), iPS (red), and IMR90 (yellow) cells, for H3K9me3 (left) and H3K27me3 (right). The total coverage of these modifications is indicated below. Regions related to reprogramming are labeled: iPS reprogrammed regions, defined as overlap of iPS and hESC but not IMR90; iPS unchanged regions, defined as overlap of iPS and IMR90 but not hESC; and iPS unique regions. (B) The average genic distribution of iPS unchanged and iPS unique regions. (C) (top) Difference in RPKM of iPS profiles compared to hESC profiles for H3K9me3 (blue) and H3K27me3 (yellow) throughout the length of chr20. (bottom) Zoomed in views of genomic regions having differences between iPS and hESC cells. (D) For the three types of iPS regions, the number of gene promoters covered by H3K9me3 (top) or H3K27me3 domains (bottom). (E) Snapshots of repressive chromatin structure at JMJD1A (left) and FZD10 (right) promoters, illustrating differences in iPS and hESC cells.

References

    1. Azuara V, Perry P, Sauer S, Spivakov M, Jorgensen HF, John RM, Gouti M, Casanova M, Warnes G, Merkenschlager M, et al. Chromatin signatures of pluripotent cell lines. Nat Cell Biol. 2006;8:532–538. - PubMed
    1. Ball MP, Li JB, Gao Y, Lee JH, LeProust EM, Park IH, Xie B, Daley GQ, Church GM. Targeted and genome-scale strategies reveal gene-body methylation signatures in human cells. Nat Biotechnol. 2009;27:361–368. - PMC - PubMed
    1. Barrand S, Collas P. Chromatin states of core pluripotency-associated genes in pluripotent, multipotent and differentiated cells. Biochem Biophys Res Commun. 2009;391:762–767. - PubMed
    1. Barski A, Cuddapah S, Cui K, Roh TY, Schones DE, Wang Z, Wei G, Chepelev I, Zhao K. High-resolution profiling of histone methylations in the human genome. Cell. 2007;129:823–837. - PubMed
    1. Ben-Shushan E, Pikarsky E, Klar A, Bergman Y. Extinction of Oct-3/4 gene expression in embryonal carcinoma x fibroblast somatic cell hybrids is accompanied by changes in the methylation status, chromatin structure, and transcriptional activity of the Oct-3/4 upstream region. Mol Cell Biol. 1993;13:891–901. - PMC - PubMed

Publication types

MeSH terms