. 2010 Sep;45(9):691-701.
doi: 10.1016/j.exger.2010.04.008. Epub 2010 May 7.

Genetic dissection of dietary restriction in mice supports the metabolic efficiency model of life extension

Affiliations

Genetic dissection of dietary restriction in mice supports the metabolic efficiency model of life extension

Brad A Rikke et al. Exp Gerontol. 2010 Sep.

Abstract

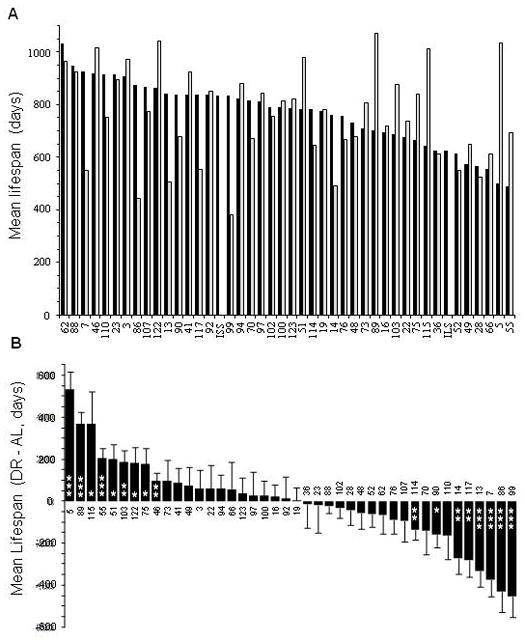
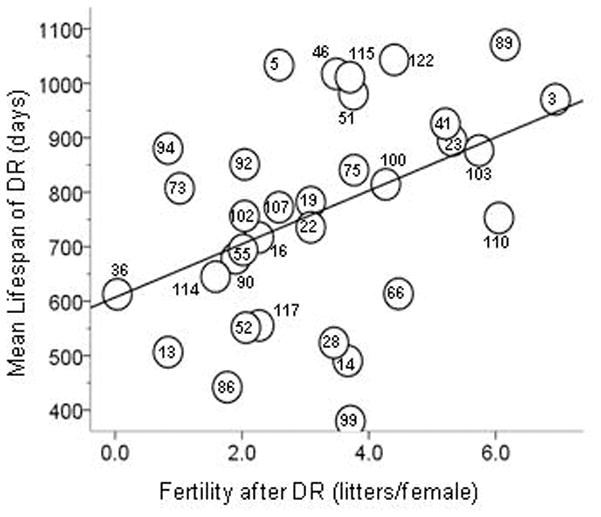
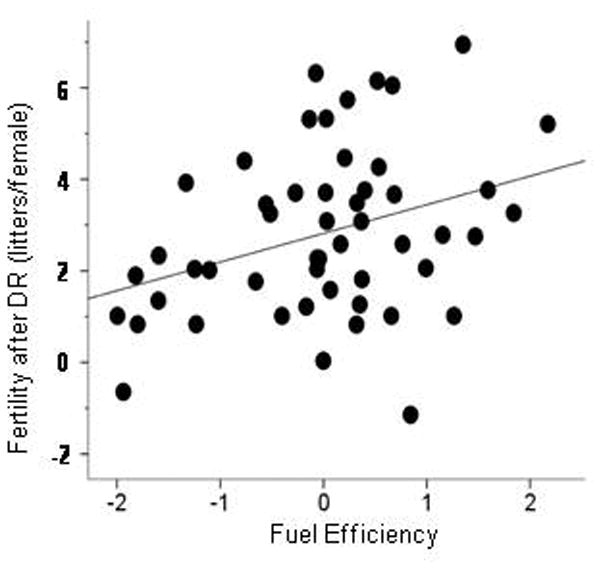
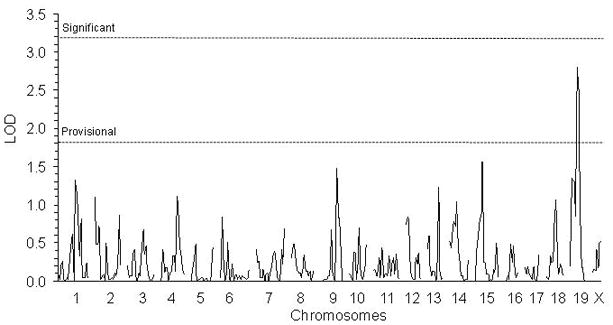
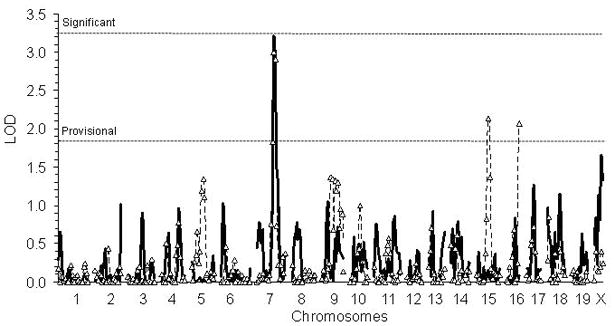
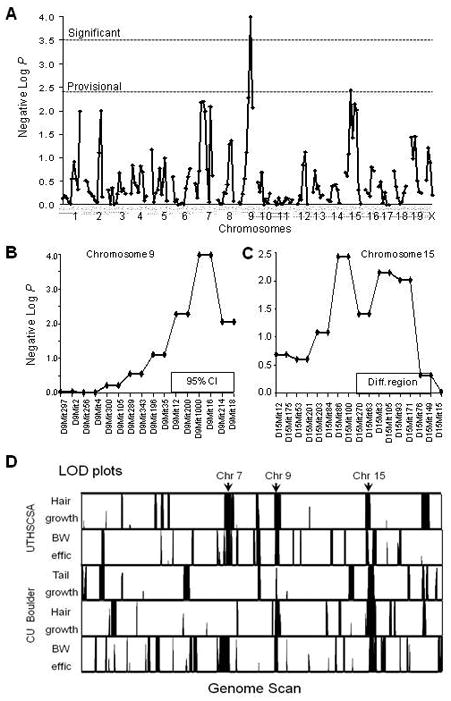
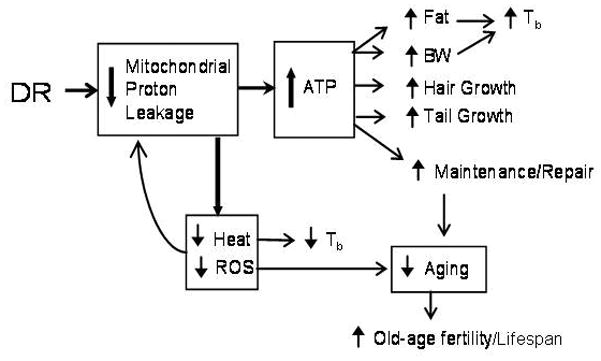
Dietary restriction (DR) has been used for decades to retard aging in rodents, but its mechanism of action remains an enigma. A principal roadblock has been that DR affects many different processes, making it difficult to distinguish cause and effect. To address this problem, we applied a quantitative genetics approach utilizing the ILSXISS series of mouse recombinant inbred strains. Across 42 strains, mean female lifespan ranged from 380 to 1070days on DR (fed 60% of ad libitum [AL]) and from 490 to 1020days on an AL diet. Longevity under DR and AL is under genetic control, showing 34% and 36% heritability, respectively. There was no correlation between lifespans on DR and AL; thus different genes modulate longevity under the two regimens. DR lifespans are significantly correlated with female fertility after return to an AL diet after various periods of DR (R=0.44, P=0.006). We assessed fuel efficiency (FE, ability to maintain growth and body weight independent of absolute food intake) using a multivariate approach and found it to be correlated with longevity and female fertility, suggesting possible causality. We found several quantitative trait loci responsible for these traits, mapping to chromosomes 7, 9, and 15. We present a metabolic model in which the anti-aging effects of DR are consistent with the ability to efficiently utilize dietary resources.


Figures

Figure 1
Figure 1. Variation of longevity under AL and DR conditions
(A) Mean lifespans of 42 ILSXISS RI strains (all female, typical Ns per strain are 10 for AL, 12 for DR, housed 5 AL or 6 DR per cage). Also shown are female lifespans of the parental strains from which these RIs were generated: ILS (N = 28) and ISS (N = 31), measured in a previous cohort under AL conditions. (B) Difference in mean lifespan (DR – AL) for each ILSXISS strain arranged in order by positive effect of DR. * P ≤ 0.05, **P ≤ 0.01, ***P ≤ 0.001; 2-tailed t-tests, no Bonferroni corrections. Error bars, S.E.
Figure 2
Figure 2. Scatterplot showing genetic correlation between longevity and female fertility responses to DR
Fertility and longevity were measured in separate cohorts. The data are from the 33 ILSXISS strains common to both studies. The numbers within or next to the data points are the strain names. R = 0.44, P = 0.006, 1-tailed.
Figure 3
Figure 3. Fuel efficiency (FE) predicts fertility after DR
The same mice from 51 ILSXISS strains were measured for both traits. FE was defined as the principal components factor representing the positive covariation among DR BW efficiency, DR hair growth, and DR tail growth. R = 0.34, P = 0.007, 1-tailed.
Figure 4
Figure 4. QTL map for longevity under AL
The threshold for statistical significance as determined by permutation testing was LOD 3.2. The cut-off for a provisional QTL was LOD 1.8.
Figure 5
Figure 5. QTL map for longevity under DR and fertility after DR
The thick solid line is the genome scan for DR mean lifespan. The dashed line with triangles at each marker is the scan for litters/female. The horizontal dashed lines indicate thresholds for significant (LOD 3.3) and provisional QTLs (LOD 1.8) as determined by permutation testing.
Figure 6
Figure 6. Mapping on fuel efficiency
(A) Negative logarithm (base 10) of the P values from a genome scan meta-analysis of the BW efficiency and growth-related responses to DR. Dashed lines indicate thresholds for significant and provisional QTLs. (B) Expanded chromosome 9 scan. Box shows 95% confidence interval. (C) Expanded chromosome 15 scan. Box shows location of ILS differential locus in ISS congenic ISS.ILS-Lore5 (5LA). (D) Genome-scan bar codes showing potential sites of overlap for the same five traits. Each scan is truncated below 0.44 LOD to remove noise and above 0.6 to visualize overlaps. BW effic = body weight efficiency as described in the text. LODs are displayed for loci positively correlated with BW efficiency at UCB. Arrows indicate loci discussed in the text. Chromosome lengths are proportional to the number of markers.
Figure 7
Figure 7. BWs of chromosome-15 congenic (5LA) and ISS control under DR
Congenic (solid line) is identical to ISS (dashed line) except for a differential region on chromosome 15 introgressed from ILS by ten generations of backcrossing (Bennett et al., 2002). For females (A) and males (B), the initial strain means for BW were identical (within 0.1 g) and both strains were fed identical rations per mouse (1.8 g/mouse/day = 60% AL, 1.5 g/mouse/day = 50% AL). BWs were measured just before feeding once each week through Week 23 and every other week thereafter. The rations were switched to 50% AL at Week 19. (C) Hair growth rate was measured under 60% AL between Weeks 14 and 17 of DR (23 days) and under 50% AL between Weeks 28 and 31 (23 days). For females, n = 24–25 for ISS and 29 for 5LA. For males, n = 21–22 for ISS and 22 for 5LA. ** P < 0.005, *** P < 0.001, 1-tailed t-tests. Cong = congenic strain.
Figure 8
Figure 8. Metabolic Efficiency Model
Abbreviations: ATP, adenosine triphosphate; BW, body weight; ROS, reactive oxygen species; Tb = body temperature. Up arrows indicate increased or enhanced; down arrows indicate decreased or slowed. Although reduced heat production is central to the model, the net effect on Tb is ambiguous because increased fat and BW reduce heat loss (Rikke and Johnson, 2007).

Similar articles

Cited by

References

    1. Allison DB, Miller RA, Austad SN, Bouchard C, Leibel R, Klebanov S, Johnson TE, Harrison DE. Genetic variability in responses to caloric restriction in animals and in regulation of metabolism and obesity in humans. J Gerontol A Biol Sci Med Sci. 2001;56:55–65. - PubMed
    1. Belknap JK. Effect of within-strain sample size on QTL detection and mapping using recombinant inbred mouse strains. Behav Genet. 1998;28:29–38. - PubMed
    1. Belknap JK, Mitchell SR, O’Toole LA, Helms ML, Crabbe JC. Type I and type II error rates for quantitative trait loci (QTL) mapping studies using recombinant inbred mouse strains. Behav Genet. 1996;26:149–160. - PubMed
    1. Bennett B, Beeson M, Gordon L, Carosone-Link P, Johnson TE. Genetic dissection of quantitative trait loci specifying sedative/hypnotic sensitivity to ethanol: mapping with interval-specific congenic recombinant lines. Alcohol Clin Exp Res. 2002;26:1615–1624. - PubMed
    1. Chesler EJ, Miller DR, Branstetter LR, Galloway LD, Jackson BL, Philip VM, Voy BH, Culiat CT, Threadgill DW, Williams RW, Churchill GA, Johnson DK, Manly KF. The Collaborative Cross at Oak Ridge National Laboratory: developing a powerful resource for systems genetics. Mamm Genome. 2008;19:382–389. - PMC - PubMed

Publication types