

Creating a population-averaged standard brain template for Japanese macaques (M. fuscata)
- PMID: 20452439
- PMCID: PMC3221050
- DOI: 10.1016/j.neuroimage.2010.05.006
Creating a population-averaged standard brain template for Japanese macaques (M. fuscata)
Abstract
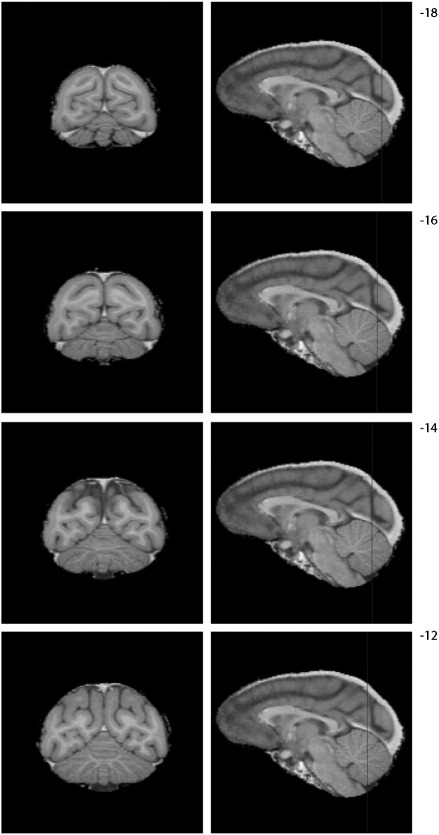
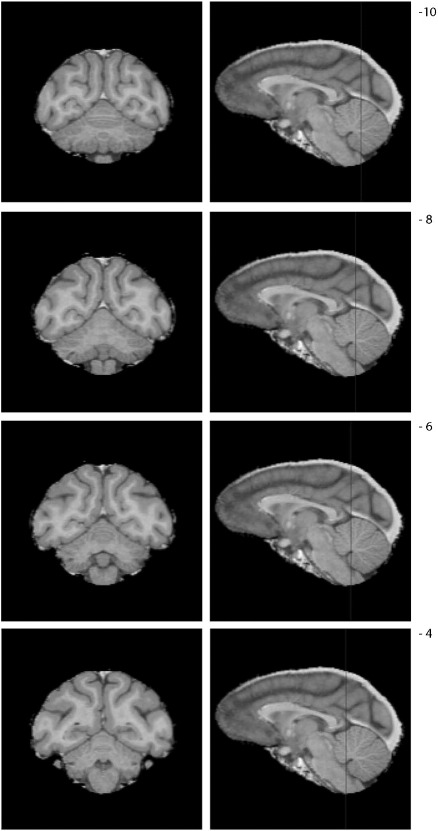
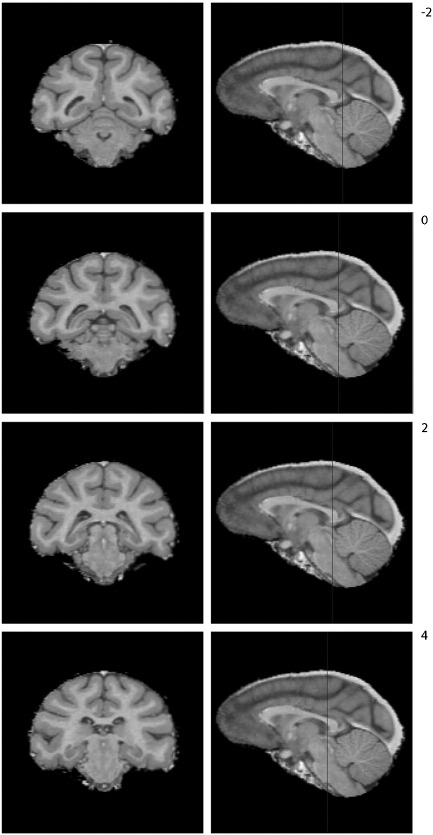
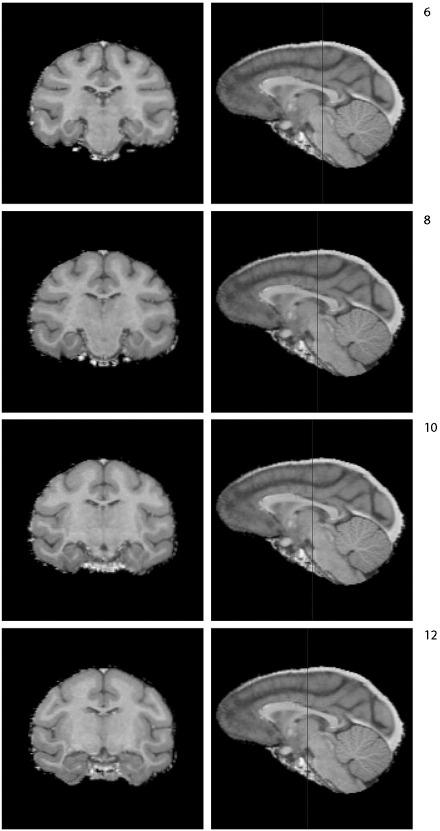
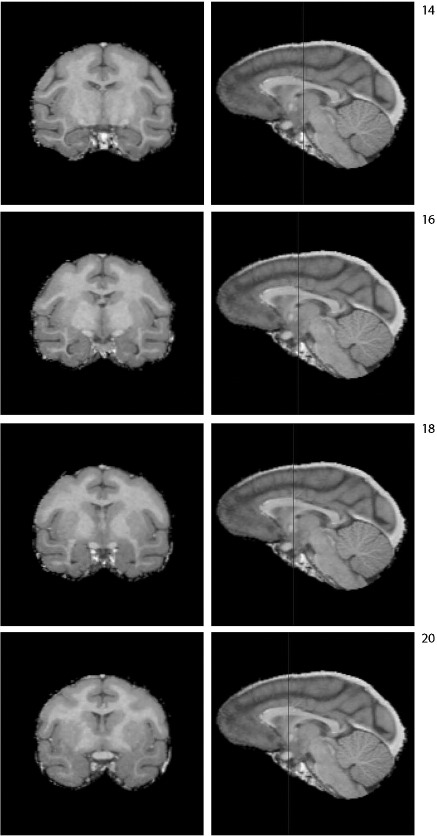
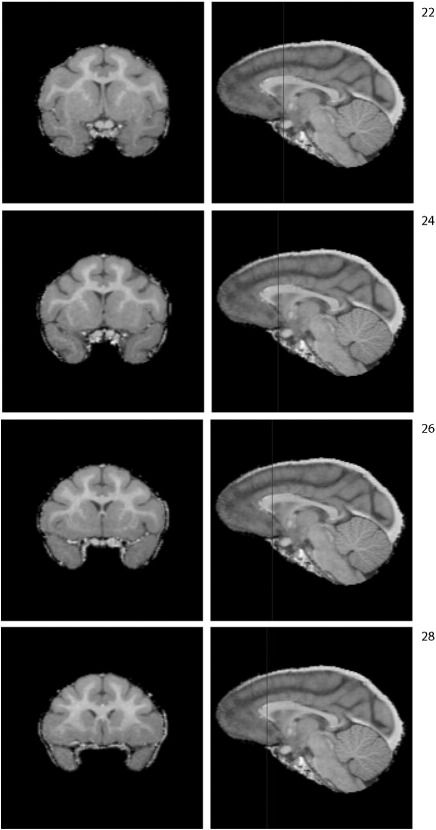
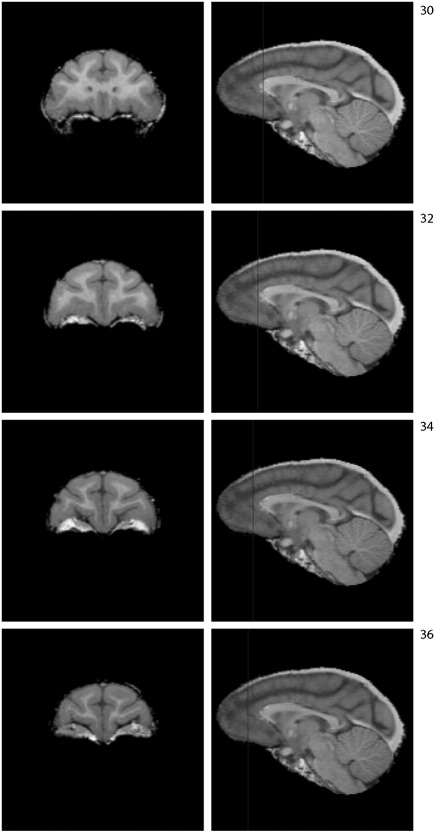
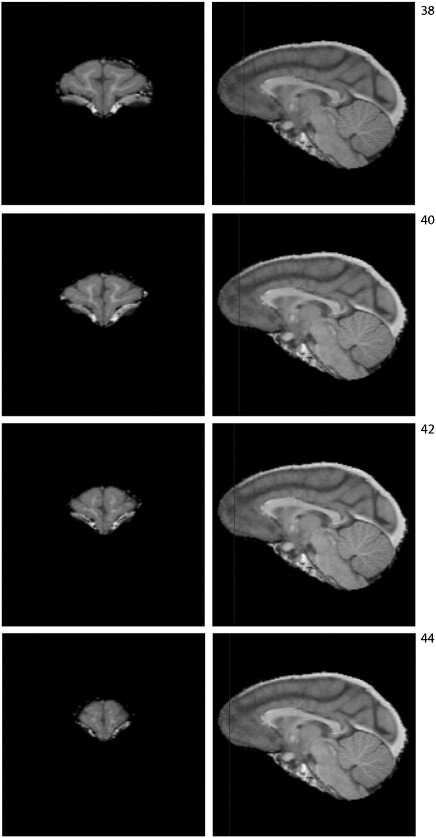
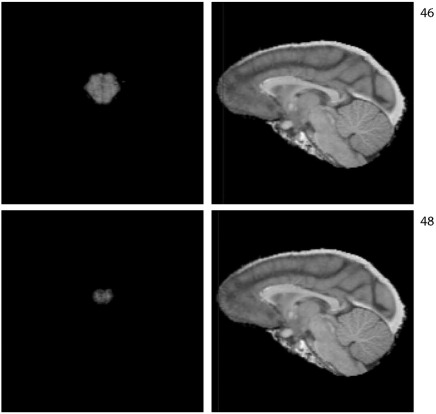
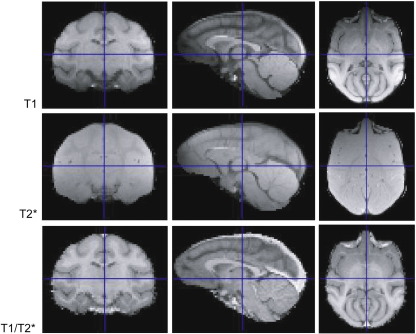
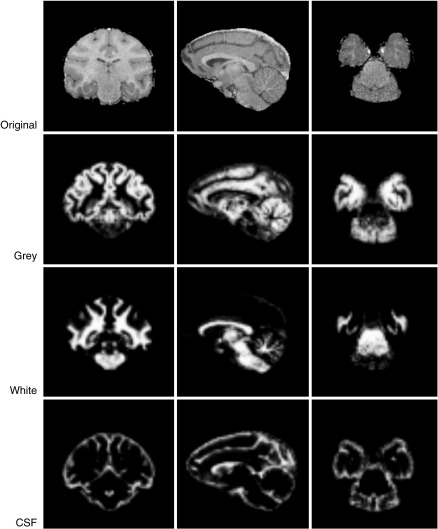
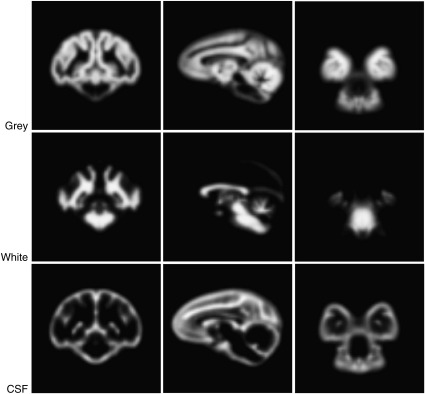
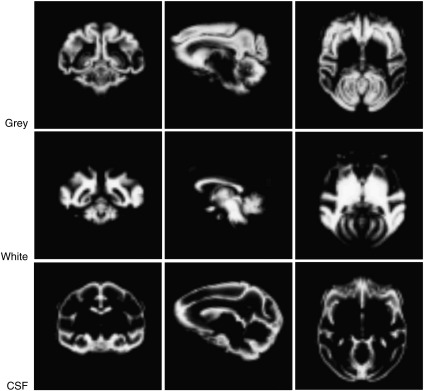
A number of modern digital anatomy techniques, based on structural MR brain images, have recently become applicable to the non-human primate brain. Such voxel-based quantitative techniques require a species-specific standardized brain template. Here we present a brain template for the Japanese macaque (Macaca fuscata). The template was designed to be used as a tool for spatially normalising Japanese macaque brains into a standard space. Although this species of macaque monkey is widely used in neuroscience research, including studies of higher cognitive brain functions, no standard MRI template of its brain is presently available. The template presented here is based on T1/T2* weighted, high-resolution 4T MR images obtained from 16 male adult Japanese macaque monkeys. T1/T2* images were used to correct the signal inequalities resulting from the use of a surface coil. Based on these images, population-averaged probability maps were created for grey matter, white matter and cerebrospinal fluid. The new template presented here should facilitate future brain research using the Japanese macaque monkey. Whole brain templates are available at http://brainatlas.brain.riken.jp/jm/modules/xoonips/listitem.php?index_id=9.
Copyright 2010 Elsevier Inc. All rights reserved.
Figures
Similar articles
-
A population MRI brain template and analysis tools for the macaque.Neuroimage. 2018 Apr 15;170:121-131. doi: 10.1016/j.neuroimage.2017.04.063. Epub 2017 Apr 28. Neuroimage. 2018. PMID: 28461058 Free PMC article. Review.
-
An MRI based average macaque monkey stereotaxic atlas and space (MNI monkey space).Neuroimage. 2011 Apr 15;55(4):1435-42. doi: 10.1016/j.neuroimage.2011.01.040. Epub 2011 Jan 20. Neuroimage. 2011. PMID: 21256229
-
Population-averaged standard template brain atlas for the common marmoset (Callithrix jacchus).Neuroimage. 2011 Feb 14;54(4):2741-9. doi: 10.1016/j.neuroimage.2010.10.061. Epub 2010 Oct 29. Neuroimage. 2011. PMID: 21044887
-
Design and construction of a brain phantom to simulate neonatal MR images.Comput Med Imaging Graph. 2011 Apr;35(3):237-50. doi: 10.1016/j.compmedimag.2010.11.007. Epub 2010 Dec 13. Comput Med Imaging Graph. 2011. PMID: 21146956
-
Current models of the marmoset brain.Neurosci Res. 2015 Apr;93:116-27. doi: 10.1016/j.neures.2015.01.009. Epub 2015 Mar 26. Neurosci Res. 2015. PMID: 25817023 Review.
Cited by
-
The INIA19 Template and NeuroMaps Atlas for Primate Brain Image Parcellation and Spatial Normalization.Front Neuroinform. 2012 Dec 6;6:27. doi: 10.3389/fninf.2012.00027. eCollection 2012. Front Neuroinform. 2012. PMID: 23230398 Free PMC article.
-
In vivo Population Averaged Stereotaxic T2w MRI Brain Template for the Adult Yucatan Micropig.Front Neuroanat. 2020 Nov 13;14:599701. doi: 10.3389/fnana.2020.599701. eCollection 2020. Front Neuroanat. 2020. PMID: 33281567 Free PMC article.
-
A population MRI brain template and analysis tools for the macaque.Neuroimage. 2018 Apr 15;170:121-131. doi: 10.1016/j.neuroimage.2017.04.063. Epub 2017 Apr 28. Neuroimage. 2018. PMID: 28461058 Free PMC article. Review.
-
A high-throughput neurohistological pipeline for brain-wide mesoscale connectivity mapping of the common marmoset.Elife. 2019 Feb 5;8:e40042. doi: 10.7554/eLife.40042. Elife. 2019. PMID: 30720427 Free PMC article.
-
An analysis approach for high-field fMRI data from awake non-human primates.PLoS One. 2012;7(1):e29697. doi: 10.1371/journal.pone.0029697. Epub 2012 Jan 6. PLoS One. 2012. PMID: 22238636 Free PMC article.
References
-
- AIST-RIO-DB, 2006. < http://riodb.ibase.aist.go.jp/brain/index.php?LANG=ENG>.
-
- Ashburner J. A fast diffeomorphic image registration algorithm. Neuroimage. 2007;38:95–113. - PubMed
-
- Ashburner J., Friston K.J. Voxel-based morphometry—the methods. Neuroimage. 2000;11:805–821. - PubMed
-
- Ashburner J., Friston K.J. Computing average shaped tissue probability templates. Neuroimage. 2009;45:333–341. - PubMed
-
- Black K.J., Koller J.M., Snyder A.Z., Perlmutter J.S. Template images for nonhuman primate neuroimaging: 2. Macaque. Neuroimage. 2001;14:744–748. - PubMed
Publication types
MeSH terms
Grants and funding
LinkOut - more resources
Full Text Sources
Medical
