. 2010 May;202(5):431.e1-34.
doi: 10.1016/j.ajog.2010.03.026.

Identification of fetal and maternal single nucleotide polymorphisms in candidate genes that predispose to spontaneous preterm labor with intact membranes

Affiliations

Identification of fetal and maternal single nucleotide polymorphisms in candidate genes that predispose to spontaneous preterm labor with intact membranes

Roberto Romero et al. Am J Obstet Gynecol. 2010 May.

Abstract

Objective: The purpose of this study was to determine whether maternal/fetal single nucleotide polymorphisms (SNPs) in candidate genes are associated with spontaneous preterm labor/delivery.

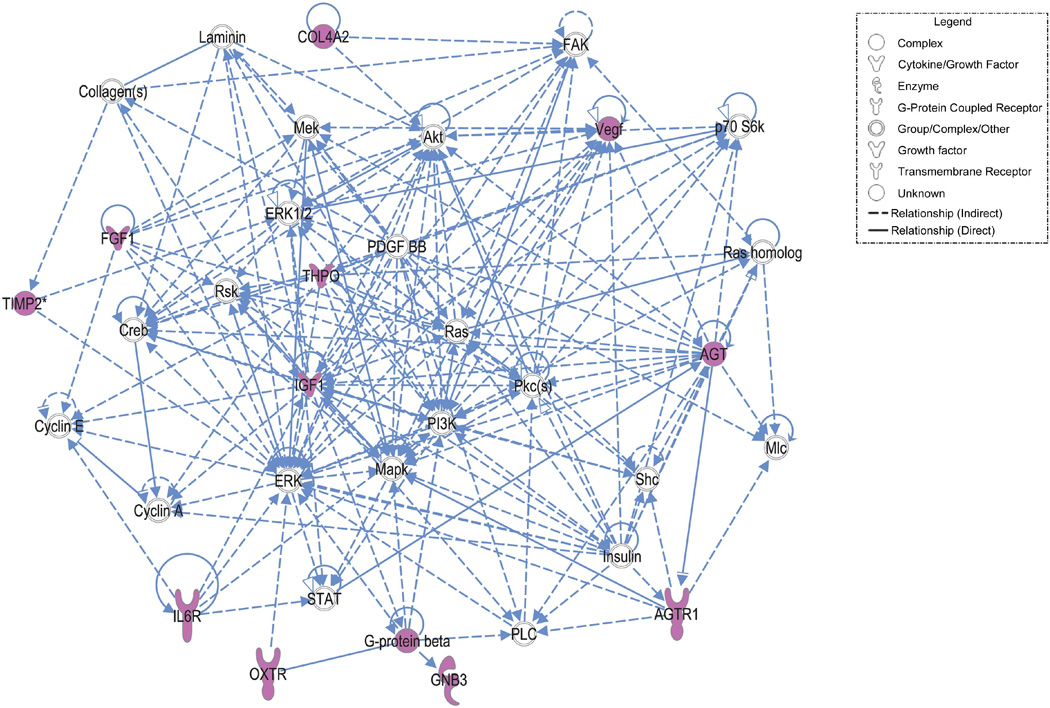
Study design: A genetic association study was conducted in 223 mothers and 179 fetuses (preterm labor with intact membranes who delivered <37 weeks of gestation [preterm birth (PTB)]), and 599 mothers and 628 fetuses (normal pregnancy); 190 candidate genes and 775 SNPs were studied. Single locus/haplotype association analyses were performed; the false discovery rate was used to correct for multiple testing.

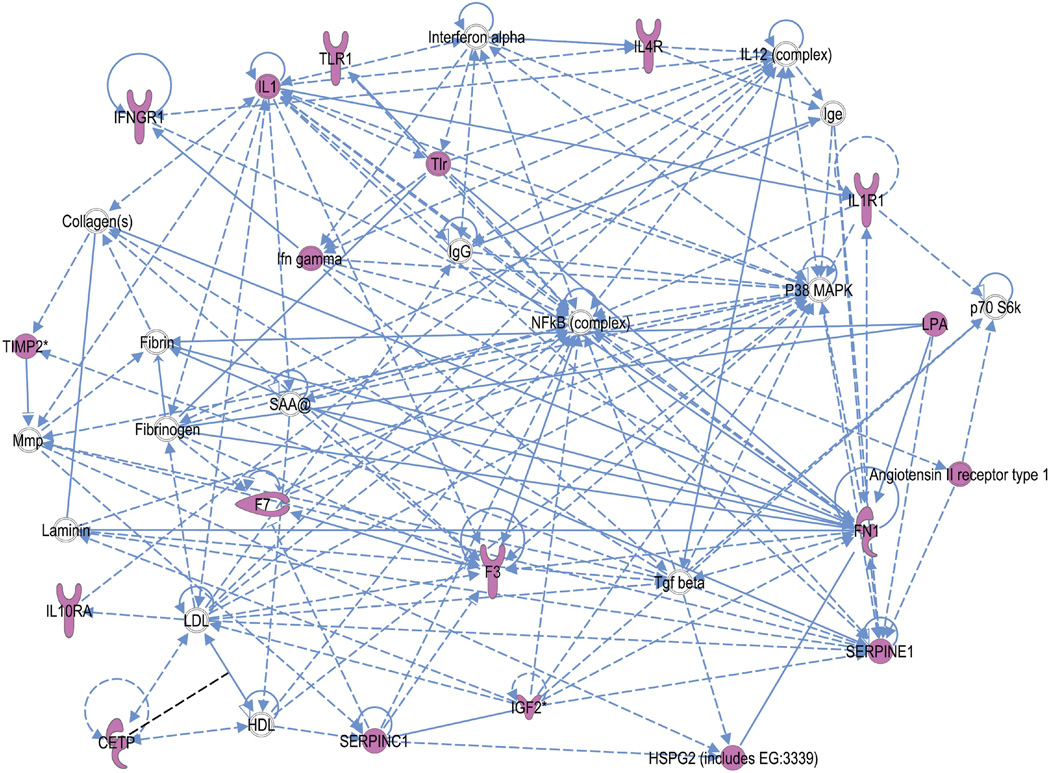
Results: The strongest single locus associations with PTB were interleukin-6 receptor 1 (fetus; P=.000148) and tissue inhibitor of metalloproteinase 2 (mother; P=.000197), which remained significant after correction for multiple comparisons. Global haplotype analysis indicated an association between a fetal DNA variant in insulin-like growth factor F2 and maternal alpha 3 type IV collagen isoform 1 (global, P=.004 and .007, respectively).

Conclusion: An SNP involved in controlling fetal inflammation (interleukin-6 receptor 1) and DNA variants in maternal genes encoding for proteins involved in extracellular matrix metabolism approximately doubled the risk of PTB.


Figures

Figure 1
Figure 1
STRUCTURE analysis of spontaneous preterm labor/delivery with intact membranes samples to detect population stratification. A) Each mother is denoted as a character with cases in RED and controls in GREEN. Also included are samples from HapMap (Phase 3). These samples are the European (CEU) (BLUE) and Asian samples (Chinese and Japanese, YELLOW) to test the hypothesis of population stratification. Clustering at the vertices indicate genetic similarity and little stratification. The samples from Chile cluster within the space defined by the European samples, supporting the hypotheses of little or no genetic stratification. B) The same analyses conducted with fetal samples included in the current study using the criteria and color coding as in (A). As with the maternal there is no evidence of substantial population stratification.
Figure 2
Figure 2
Patterns of linkage disequilibrium for genes associated in haplotype analyses of maternal samples in this study. Case and control patterns of LD are shown separately. Haploview plots are presented with the SNPs and relative locations within the gene across the top of each panel. The bottom of each figure shows the pair-wise linkage disequilibrium values of all SNPs as measured by D’. D’ is a standardized measure of linkage disequilibrium D’ values are given in each diamond. D’ between each pairwise combination of SNPs is given in each diamond on a scale of 0–100. A value of 100 represents maximum possible linkage disequilibrium. Specifically, in panel (a) the D’ between rs1882435 (687) and rs35467545 (693) can be seen by tracing down from each SNP to the diamond where the lines intersect. In this case, D’ is 52. Solid red diamonds represent a D’ of 100 and blue diamonds are values with low logarithm of the odds (LOD) scores (<2) and hence unreliable values. White diamonds represent evidence of strong recombination and hence little LD. a. COL4A3 cases; b. COL4A3 controls; c. IL6R cases; d. IL6R controls; e. FGF1 cases; f. FGF1 controls; g.LTF cases; h. LTF controls.
Figure 3
Figure 3
Patterns of linkage disequilibrium for genes associated in haplotype analyses of fetal samples in this study. Case and control patterns of LD are shown separately. Haploview plots are presented with the SNPs and relative locations within the gene across the top of each panel. The bottom of each figure shows the pair-wise linkage disequilibrium values of all SNPs as measured by D’. D’ is a standardized measure of linkage disequilibrium on a scale of 0–100. D’ values are given in each diamond. A value of 100 represents maximum possible linkage disequilibrium. Solid red diamonds represent a D’ of 100 and blue diamonds are values with low logarithm of the odds (LOD) scores (<2) and hence unreliable values. White diamonds represent evidence of strong recombination and hence little LD. a. IGF2 cases; b. IGF2 controls; c. IL2 cases; d. IL2 controls; e. COL4A1 cases; f. COL4A1 controls.
Figure 4
Figure 4
MDR model for a three-way interaction involving maternal SNP rs3752896 (COL4A4) and fetal SNPs rs34003 (FGF1) and rs598893 (COL4A1). Each panel represents a three locus genotype; the genotype for each SNP is labeled on the figure. Each large square (3 × 3 box) represents a different genotype for rs598893_2 (GG on left, AG in the middle, and AA on the right). Within each square, each row of cells delineates rs34003_2 genotypes (top TT, middle GT and bottom GG) and each column the rs3752896 genotypes. Therefore, each small cell describes a single and unique three locus genotype. Within each cell are two bars that represent the number of cases with this genotype (left hand bar) and number of controls (right hand bar). Each multilocus cell is denoted as “high risk” (dark gray) or “low risk” (light gray) for spontaneous preterm labor/delivery with intact membranes. Risk status is determined by the ratio of cases to controls adjusted by the number of cases and controls studied. The testing average balanced accuracy is 62% (p-value = 0.043) with a cross-validation consistency of 6 out of 10.
Figure 5
Figure 5
Connection map for the first ranked network generated by IPA from maternal focus gene input. The biomarkers passing the p < 0.05 significance threshold (focus molecules, depicted in pink) were entered in to the IPA software for an unsupervised functional analysis to discern regulatory networks involving these molecules. The asterisk indicates that there was more than one SNP probe for the gene tested and the most significant value was placed into the analysis. Solid lines show direct interaction (binding/physical contact); dashed line, indirect interaction supported by the literature but possibly involving one or more intermediate molecules that have not been investigated definitively. Molecular interactions involving only binding are connected with a line without an arrowhead since directionality cannot be inferred.
Figure 6
Figure 6
Connection map for the first ranked network generated by IPA from fetal focus gene input. The biomarkers passing the p < 0.05 significance threshold (focus molecules, depicted in pink) were entered in to the IPA software for an unsupervised functional analysis to discern regulatory networks involving these molecules. The asterisk indicates that there was more than one SNP probe for the gene tested and the most significant value was placed into the analysis. Solid lines show direct interaction (binding/physical contact); dashed line, indirect interaction supported by the literature but possibly involving one or more intermediate molecules that have not been investigated definitively. Molecular interactions involving only binding are connected with a line without an arrowhead since directionality cannot be inferred. The symbol, “SAA@” indicates serum amyloid, which includes SAA1, SAA2, SAA3P, and SAA4.
Figure 7
Figure 7
Linkage disequilibrium pattern of IL6R region in the HapMap CEU samples of IL6R SNPs from the current study and that of Velez et al. The Haploview figure is as described in Supplemental Figure 2. The SNP that associated with spontaneous preterm labor/delivery with intact membranes in the current study (rs 8192282) is denoted by a rectangle surrounding it in the top of the panel. All other SNPs are from associating haplotypes in Velez et al.

Comment in

Similar articles

Cited by

References

    1. McCormick MC. The contribution of low birth weight to infant mortality and childhood morbidity. N.Engl.J.Med. 1985;312:82–90. - PubMed
    1. Slattery MM, Morrison JJ. Preterm delivery. Lancet. 2002;360:1489–1497. - PubMed
    1. Goldenberg RL, Culhane JF, Iams JD, Romero R. Epidemiology and causes of preterm birth. Lancet. 2008;371:75–84. - PMC - PubMed
    1. Biggio J, Christiaens I, Katz M, Menon R, Merialdi M, Morken NH, et al. A call for an international consortium on the genetics of preterm birth. Am J Obstet.Gynecol. 2008;199:95–97. - PubMed
    1. Chaudhari BP, Plunkett J, Ratajczak CK, Shen TT, DeFranco EA, Muglia LJ. The genetics of birth timing: insights into a fundamental component of human development. Clin.Genet. 2008;74:493–501. - PubMed

Publication types

MeSH terms

Substances