. 2010 May;202(5):474.e1-20.
doi: 10.1016/j.ajog.2010.02.034.

Human effector/initiator gene sets that regulate myometrial contractility during term and preterm labor

Affiliations

Human effector/initiator gene sets that regulate myometrial contractility during term and preterm labor

Carl P Weiner et al. Am J Obstet Gynecol. 2010 May.

Abstract

Objective: Distinct processes govern transition from quiescence to activation during term (TL) and preterm labor (PTL). We sought gene sets that are responsible for TL and PTL, along with the effector genes that are necessary for labor independent of gestation and underlying trigger.

Study design: Expression was analyzed in term and preterm with or without labor (n=6 subjects/group). Gene sets were generated with logic operations.

Results: Thirty-four genes were expressed similarly in PTL/TL but were absent from nonlabor samples (effector set); 49 genes were specific to PTL (preterm initiator set), and 174 genes were specific to TL (term initiator set). The gene ontogeny processes that comprise term initiator and effector sets were diverse, although inflammation was represented in 4 of the top 10; inflammation dominated the preterm initiator set.

Conclusion: TL and PTL differ dramatically in initiator profiles. Although inflammation is part of the term initiator and the effector sets, it is an overwhelming part of PTL that is associated with intraamniotic inflammation.


Figures

FIGURE 1
FIGURE 1
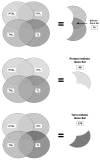
Venn diagram illustrating the logic process for the derivation of the three unique gene sets. The number refers to the number of genes identified in the various subgroups.
FIGURE 2
FIGURE 2
FIGURE 2a. The Gene Ontology table was generated from the genes of the Effector set in MetaCore. The top 10 Genego GO pathways are listed in the table based on the number of selected genes that saturate each biological area. These processes are prioritized by MetaCore™ based on their statistical significance (−log (p value) with respect to genes expressed in the dataset. A false discovery rate filter set at 10% was also used to illustrate significant processes. The bars representing experiment mappings that do not pass through this significance level are semi-transparent. FIGURE 2b. Interactive network of the Effector Gene Set was determined using the analyze network algorithm. This algorithm designs sub-networks that are highly saturated with genes of the Effector Set. Selection of the network was based on significance (P-value). The p-value calculation was used to evaluate network’s relevance to GO biological processes classification. The network illustrates gene and gene interactions within Effector Set. Canonical pathways are illustrated by a thick light blue line and represent linear stretches of carefully defined sets of consecutive signals confirmed as a whole by experimental data. The small colored hexagons on vectors (lines) between nodes describe positive (green), negative (red), unspecified (black) interactions, or logical relationships (blue). A node corresponds to a network object (i.e. gene or protein) and is marked with a graphical symbol that reflects the type of the network object represented (i.e. enzyme, transcription factor, ligand, etc.). The large red circle next to the network object corresponds to those genes detected in the Effector Set. The network objects are placed in specific vectors of this network according to their sub-cellular localization. The localization sectors are Nucleus, Cytoplasm, Membrane, Extracellular, and Unspecified.
FIGURE 2
FIGURE 2
FIGURE 2a. The Gene Ontology table was generated from the genes of the Effector set in MetaCore. The top 10 Genego GO pathways are listed in the table based on the number of selected genes that saturate each biological area. These processes are prioritized by MetaCore™ based on their statistical significance (−log (p value) with respect to genes expressed in the dataset. A false discovery rate filter set at 10% was also used to illustrate significant processes. The bars representing experiment mappings that do not pass through this significance level are semi-transparent. FIGURE 2b. Interactive network of the Effector Gene Set was determined using the analyze network algorithm. This algorithm designs sub-networks that are highly saturated with genes of the Effector Set. Selection of the network was based on significance (P-value). The p-value calculation was used to evaluate network’s relevance to GO biological processes classification. The network illustrates gene and gene interactions within Effector Set. Canonical pathways are illustrated by a thick light blue line and represent linear stretches of carefully defined sets of consecutive signals confirmed as a whole by experimental data. The small colored hexagons on vectors (lines) between nodes describe positive (green), negative (red), unspecified (black) interactions, or logical relationships (blue). A node corresponds to a network object (i.e. gene or protein) and is marked with a graphical symbol that reflects the type of the network object represented (i.e. enzyme, transcription factor, ligand, etc.). The large red circle next to the network object corresponds to those genes detected in the Effector Set. The network objects are placed in specific vectors of this network according to their sub-cellular localization. The localization sectors are Nucleus, Cytoplasm, Membrane, Extracellular, and Unspecified.
FIGURE 3
FIGURE 3
FIGURE 3a. Similar to figure 2a, this Gene Ontology table is representative of the Term Initiator Gene Set. The genes included are more varied than those of the Preterm Initiator Set. FIGURE 3b. Similar to figures 2b, this Term Initiator sub-network was generated using the analyze network algorithm (Metacore™). The large red circle next to the network object corresponds to those genes detected in the Term Initiator Group. Selection of the network was based on significance (P-value).
FIGURE 3
FIGURE 3
FIGURE 3a. Similar to figure 2a, this Gene Ontology table is representative of the Term Initiator Gene Set. The genes included are more varied than those of the Preterm Initiator Set. FIGURE 3b. Similar to figures 2b, this Term Initiator sub-network was generated using the analyze network algorithm (Metacore™). The large red circle next to the network object corresponds to those genes detected in the Term Initiator Group. Selection of the network was based on significance (P-value).
FIGURE 4
FIGURE 4
FIGURE 4a. This figure illustrates the major Gene Ontology pathways underlying the Preterm Initiator Gene Set. There is a high correlation between inflammation and the Preterm Initiator Gene Set. FIGURE 4b. The Preterm Initiator Set sub-network was generated using the analyze network algorithm (Metacore™). The large red circle next to the network object corresponds to those genes detected in the Preterm Initiator Group. Selection of the network was based on significance (P-value).
FIGURE 4
FIGURE 4
FIGURE 4a. This figure illustrates the major Gene Ontology pathways underlying the Preterm Initiator Gene Set. There is a high correlation between inflammation and the Preterm Initiator Gene Set. FIGURE 4b. The Preterm Initiator Set sub-network was generated using the analyze network algorithm (Metacore™). The large red circle next to the network object corresponds to those genes detected in the Preterm Initiator Group. Selection of the network was based on significance (P-value).
FIGURE 5
FIGURE 5
The Effector Set represents genes that sustain myometrial contractility and are unaffected by stimulus. HNT, KCNAB2, RRAD were selected for study to verify the microarray results. mRNA levels were determined in the myometrium of term (n=6; 39.7w) and preterm with inflammation (n=6; 30.9w) pregnant women in active labor and not-in-labor (term n=6; 39.6w, preterm n=6; 28.9w) via Q-rtPCR using the Livak Method. Microarray findings were confirmed for all but one gene tested. In general, the findings confirm both the microarray findings and the presence of core genes associated with labor regardless of its timing.
FIGURE 6
FIGURE 6
Term Initiator Set genes EREG, BDKRB1, IL13RA2 mRNA levels were significantly greater at term labor (open bar) than preterm labor (close bar) in myometrium. mRNA levels were determined in the myometrium of term (n=6; 39.7w) and preterm with inflammation (n=6; 30.9w) pregnant women in active labor and not-in-labor (term n=6; 39.6w, preterm n=6; 28.9w) via Q-rtPCR using the Livak Method. Microarray findings were confirmed for all but one gene tested. EREG and BDKRB1 mRNA levels were significantly higher at labor (open bar) than non labor (close bar) in term myometrium. Only IL9R Q-rtPCR results different from the microarray.
FIGURE 7
FIGURE 7
Preterm Initiator Set- mRNA levels were determined as indicated previously. Changes in the mRNA levels for genes Catsper2 and Ptprz1 were consistent with the array data.

Similar articles

Cited by

References

    1. Breuiller-Fouche M, Germain G. Gene and protein expression in the myometrium in pregnancy and labor. Reproduction. 2006;131:837–50. - PubMed
    1. Carbillon L, Seince N, Uzan M. Myometrial maturation and labour. Ann Med. 2001;33:571–8. - PubMed
    1. Norwitz ER, Robinson JN, Challis JR. The control of labor. N Engl J Med. 1999;341:660–6. - PubMed
    1. Buxton IL. Regulation of uterine function: a biochemical conundrum in the regulation of smooth muscle relaxation. Mol Pharmacol. 2004;65:1051–9. - PubMed
    1. Hillhouse EW, Grammatopoulos DK. Role of stress peptides during human pregnancy and labour. Reproduction. 2002;124:323–9. - PubMed

Publication types