Thymic changes after chorioamnionitis induced by intraamniotic lipopolysaccharide in fetal sheep
- PMID: 20452494
- PMCID: PMC2868266
- DOI: 10.1016/j.ajog.2010.02.035
Thymic changes after chorioamnionitis induced by intraamniotic lipopolysaccharide in fetal sheep
Abstract
Objective: Regulatory T lymphocytes mediate homeostasis of the immune system and differentiate under the control of the transcription factor FoxP3 in the fetal thymus. We asked whether fetal inflammation caused by chorioamnionitis would modulate thymus development.
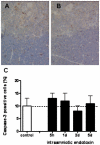
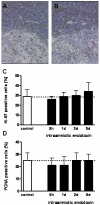
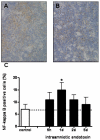
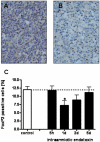
Study design: Fetal sheep were exposed to an intraamniotic injection of 10 mg lipopolysaccharide at 5 hours, 1 day, 2 days, or 5 days before delivery at 123 gestation days. Cord blood lymphocytes, plasma cortisol, and thymus weight were measured. Glucocorticoid receptor-, activated caspase-3-, Ki-67-, proliferating cell nuclear antigen-, nuclear factor-kappaB-, and FoxP3-positive cells were immunohistochemically evaluated in thymus.
Results: Intraamniotic lipopolysaccharide exposure decreased the number of circulating lymphocytes by 40% after 1 day. Thymus-to-body weight ratios were reduced in all lipopolysaccharide groups by a maximum of 40% at 5 days. Lipopolysaccharide exposure modestly increased plasma cortisol concentration, increased nuclear factor-kappaB immunostaining in fetal thymus and reduced the number of FoxP3-positive cells by 40% at 1 day.
Conclusion: Intraamniotic exposure to lipopolysaccharide induced thymic changes and influenced thymic FoxP3 expression.
Copyright (c) 2010 Mosby, Inc. All rights reserved.
Figures


Similar articles
-
Intraamniotic lipopolysaccharide exposure changes cell populations and structure of the ovine fetal thymus.Reprod Sci. 2013 Aug;20(8):946-56. doi: 10.1177/1933719112472742. Epub 2013 Jan 11. Reprod Sci. 2013. PMID: 23314960 Free PMC article.
-
Ovine fetal thymus response to lipopolysaccharide-induced chorioamnionitis and antenatal corticosteroids.PLoS One. 2012;7(5):e38257. doi: 10.1371/journal.pone.0038257. Epub 2012 May 31. PLoS One. 2012. PMID: 22693607 Free PMC article.
-
Pharmacological blockade of the interleukin-1 receptor suppressed Escherichia coli lipopolysaccharide-induced neuroinflammation in preterm fetal sheep.Am J Obstet Gynecol MFM. 2023 Nov;5(11):101124. doi: 10.1016/j.ajogmf.2023.101124. Epub 2023 Aug 18. Am J Obstet Gynecol MFM. 2023. PMID: 37597799
-
Fetal immune response to chorioamnionitis.Semin Reprod Med. 2014 Jan;32(1):56-67. doi: 10.1055/s-0033-1361823. Epub 2014 Jan 3. Semin Reprod Med. 2014. PMID: 24390922 Free PMC article. Review.
-
Regulation of T cell homeostasis during fetal and early postnatal life.Vet Immunol Immunopathol. 1999 Dec 15;72(1-2):175-81. doi: 10.1016/s0165-2427(99)00130-0. Vet Immunol Immunopathol. 1999. PMID: 10614507 Review.
Cited by
-
Regulatory T cell frequencies are increased in preterm infants with clinical early-onset sepsis.Clin Exp Immunol. 2016 Aug;185(2):219-27. doi: 10.1111/cei.12810. Epub 2016 Jun 12. Clin Exp Immunol. 2016. PMID: 27163159 Free PMC article.
-
Feto-maternal allo-immunity, regulatory T cells and predisposition to auto-immunity. Does it all start in utero?Chimerism. 2014;5(2):59-62. doi: 10.4161/chim.29844. Chimerism. 2014. PMID: 25111980 Free PMC article.
-
Understanding Host-Pathogen Interactions in Acute Chorioamnionitis Through the Use of Animal Models.Front Cell Infect Microbiol. 2021 Jul 27;11:709309. doi: 10.3389/fcimb.2021.709309. eCollection 2021. Front Cell Infect Microbiol. 2021. PMID: 34386434 Free PMC article. Review.
-
Intrauterine inflammation alters fetal cardiopulmonary and cerebral haemodynamics in sheep.J Physiol. 2013 Oct 15;591(20):5061-70. doi: 10.1113/jphysiol.2013.259119. Epub 2013 Jul 22. J Physiol. 2013. PMID: 23878364 Free PMC article.
-
Bacteria in the amniotic fluid without inflammation: early colonization vs. contamination.J Perinat Med. 2021 Jul 7;49(9):1103-1121. doi: 10.1515/jpm-2021-0191. Print 2021 Nov 25. J Perinat Med. 2021. PMID: 34229367 Free PMC article.
References
-
- Ciofani M, Zuniga-Pflucker JC. The thymus as an inductive site for T lymphopoiesis. Annu Rev Cell Dev Biol. 2007;23:463–93. - PubMed
-
- Selye H. thymus and adrenals in response of the injuries and intoxications. Br J Exp Pathl. 1936;17:1155–1160.
-
- Suster S, Rosai J. Histology of the normal thymus. Am J Surg Pathol. 1990;14:284–303. - PubMed
-
- Glavina-Durdov M, Springer O, Capkun V, Saratlija-Novakovic Z, Rozic D, Barle M. The grade of acute thymus involution in neonates correlates with the duration of acute illness and with the percentage of lymphocytes in peripheral blood smear. Pathological study. Biol Neonate. 2003;83:229–34. - PubMed
Publication types
MeSH terms
Substances
Grants and funding
LinkOut - more resources
Full Text Sources
Research Materials

