

Triglyceride-mediated pathways and coronary disease: collaborative analysis of 101 studies
- PMID: 20452521
- PMCID: PMC2867029
- DOI: 10.1016/S0140-6736(10)60545-4
Triglyceride-mediated pathways and coronary disease: collaborative analysis of 101 studies
Erratum in
- Lancet. 2010 Jul 10;376(9735):90. Kastelein, J J [added]
Abstract
Background: Whether triglyceride-mediated pathways are causally relevant to coronary heart disease is uncertain. We studied a genetic variant that regulates triglyceride concentration to help judge likelihood of causality.
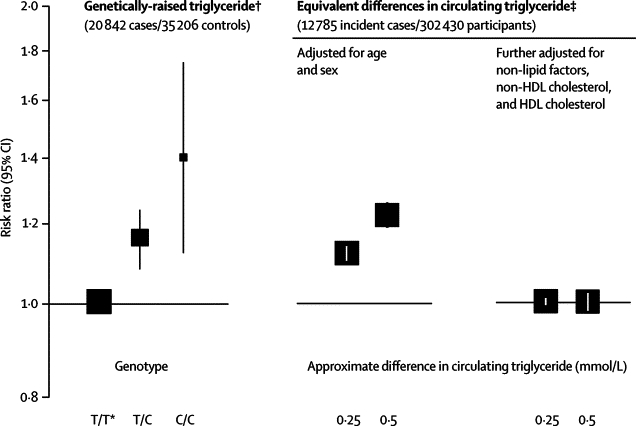
Methods: We assessed the -1131T>C (rs662799) promoter polymorphism of the apolipoprotein A5 (APOA5) gene in relation to triglyceride concentration, several other risk factors, and risk of coronary heart disease. We compared disease risk for genetically-raised triglyceride concentration (20,842 patients with coronary heart disease, 35,206 controls) with that recorded for equivalent differences in circulating triglyceride concentration in prospective studies (302 430 participants with no history of cardiovascular disease; 12,785 incident cases of coronary heart disease during 2.79 million person-years at risk). We analysed -1131T>C in 1795 people without a history of cardiovascular disease who had information about lipoprotein concentration and diameter obtained by nuclear magnetic resonance spectroscopy.
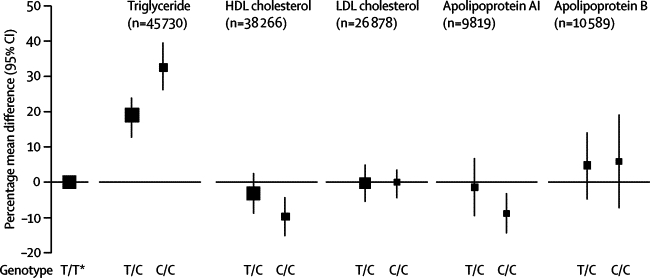
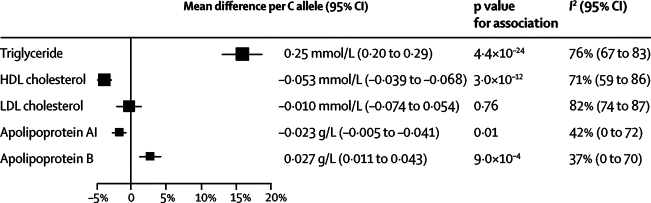
Findings: The minor allele frequency of -1131T>C was 8% (95% CI 7-9). -1131T>C was not significantly associated with several non-lipid risk factors or LDL cholesterol, and it was modestly associated with lower HDL cholesterol (mean difference per C allele 3.5% [95% CI 2.6-4.6]; 0.053 mmol/L [0.039-0.068]), lower apolipoprotein AI (1.3% [0.3-2.3]; 0.023 g/L [0.005-0.041]), and higher apolipoprotein B (3.2% [1.3-5.1]; 0.027 g/L [0.011-0.043]). By contrast, for every C allele inherited, mean triglyceride concentration was 16.0% (95% CI 12.9-18.7), or 0.25 mmol/L (0.20-0.29), higher (p=4.4x10(-24)). The odds ratio for coronary heart disease was 1.18 (95% CI 1.11-1.26; p=2.6x10(-7)) per C allele, which was concordant with the hazard ratio of 1.10 (95% CI 1.08-1.12) per 16% higher triglyceride concentration recorded in prospective studies. -1131T>C was significantly associated with higher VLDL particle concentration (mean difference per C allele 12.2 nmol/L [95% CI 7.7-16.7]; p=9.3x10(-8)) and smaller HDL particle size (0.14 nm [0.08-0.20]; p=7.0x10(-5)), factors that could mediate the effects of triglyceride.
Interpretation: These data are consistent with a causal association between triglyceride-mediated pathways and coronary heart disease.
Funding: British Heart Foundation, UK Medical Research Council, Novartis.
Copyright 2010 Elsevier Ltd. All rights reserved.
Figures
Comment in
-
Mendelian randomisation, triglycerides, and CHD.Lancet. 2010 May 8;375(9726):1584-6. doi: 10.1016/S0140-6736(10)60659-9. Lancet. 2010. PMID: 20452504 No abstract available.
-
Triglyceride-mediated pathways and coronary heart disease.Lancet. 2010 Sep 18;376(9745):956-7; author reply 957-8. doi: 10.1016/S0140-6736(10)61448-1. Lancet. 2010. PMID: 20851255 No abstract available.
-
Triglyceride-mediated pathways and coronary heart disease.Lancet. 2010 Sep 18;376(9745):956; author reply 957-8. doi: 10.1016/S0140-6736(10)61447-X. Lancet. 2010. PMID: 20851256 No abstract available.
-
Triglyceride-mediated pathways and coronary heart disease.Lancet. 2010 Sep 18;376(9745):957; author reply 957-8. doi: 10.1016/S0140-6736(10)61449-3. Lancet. 2010. PMID: 20851258 No abstract available.
References
-
- Sarwar N, Danesh J, Eiriksdottir G. Triglycerides and the risk of coronary heart disease: 10 158 incident cases among 262 525 participants in 29 western prospective studies. Circulation. 2007;115:450–458. - PubMed
-
- Phillips A, Smith G Davey. How independent are “independent” effects? Relative risk estimation when correlated exposures are measured imprecisely. J Clin Epidemiol. 1991;44:1223–1231. - PubMed
-
- Preiss D, Sattar N. Lipids, lipid modifying agents and cardiovascular risk: a review of the evidence. Clin Endocrinol. 2009;70:815–828. - PubMed
-
- Smith G Davey, Ebrahim S. ‘Mendelian randomization’: can genetic epidemiology contribute to understanding environmental determinants of disease? Int J Epidemiol. 2003;32:1–22. - PubMed
Publication types
MeSH terms
Substances
Grants and funding
- RG/08/008/25291/BHF_/British Heart Foundation/United Kingdom
- G0600705/MRC_/Medical Research Council/United Kingdom
- RG/08/014/24067/BHF_/British Heart Foundation/United Kingdom
- G0501792/MRC_/Medical Research Council/United Kingdom
- RG/08/013/25942/BHF_/British Heart Foundation/United Kingdom
- MC_U137686857/MRC_/Medical Research Council/United Kingdom
- G0401527/MRC_/Medical Research Council/United Kingdom
- G0701863/MRC_/Medical Research Council/United Kingdom
- MC_U105260792/MRC_/Medical Research Council/United Kingdom
- G0801566/MRC_/Medical Research Council/United Kingdom
- WT_/Wellcome Trust/United Kingdom
LinkOut - more resources
Full Text Sources
Other Literature Sources
Miscellaneous
