Review
. 2010 May;2(5):a002147.
doi: 10.1101/cshperspect.a002147. Epub 2010 Mar 31.

The origin of biological homochirality

Affiliations
Review

The origin of biological homochirality

Donna G Blackmond. Cold Spring Harb Perspect Biol. 2010 May.

Abstract

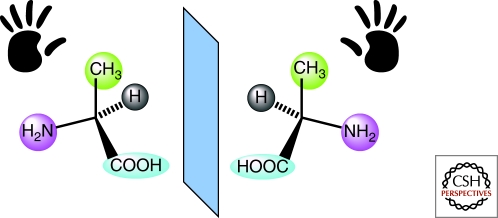
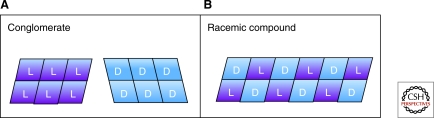
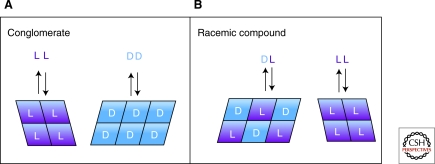
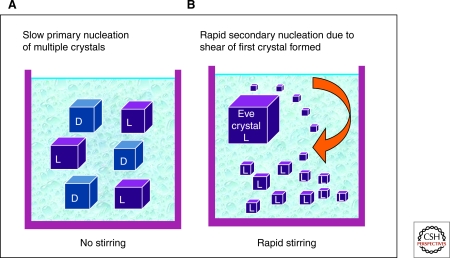
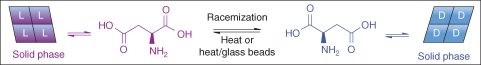
The single-handedness of biological molecules has fascinated scientists and laymen alike since Pasteur's first painstaking separation of the enantiomorphic crystals of a tartrate salt more than 150 yr ago. More recently, a number of theoretical and experimental investigations have helped to delineate models for how one enantiomer might have come to dominate over the other from what presumably was a racemic prebiotic world. This article highlights mechanisms for enantioenrichment that include either chemical or physical processes, or a combination of both. The scientific driving force for this work arises from an interest in understanding the origin of life, because the homochirality of biological molecules is a signature of life.


Figures

Figure 1.
Figure 1.
The two mirror-image enantiomers of the amino acid alanine.
Figure 2.
Figure 2.
Schematic representation of the Frank model for the evolution of homochirality based on autocatalytic replication and mutual antagonism of enantiomers.
Scheme 1.
Scheme 1.
The Soai autocatalytic reaction, in which the product catalyzes its own formation. The –CH3 group in the pyrimidyl aldehyde may be replaced with other groups such as alkynyl groups.
Figure 3.
Figure 3.
Product enantiomeric excess as a function of reaction progress in the Soai reaction of Scheme 1. Reactions catalyzed by 10 mol% of the reaction product with an initial ee of 6% and 22% (Buono and Blackond, 2003). Prediction of the Blackmond/Brown kinetic model (solid blue lines) and experimental values from HPLC analysis (filled magenta circles).
Figure 4.
Figure 4.
Two types of crystalline solids formed by chiral compounds. Rectangles represent solid phase enantiomeric molecules. (A) conglomerates form separate crystals of each enantiomer; (B) racemic compounds form mixed crystals in a 1:1 ratio of the two enantiomers.
Figure 5.
Figure 5.
Depiction of equilibrium between chiral crystalline solids and their aqueous solution phases for nonracemic mixtures of enantiomers. Rectangles represent solid phase enantiomeric molecules; colored letters represent solution phase molecules in equilibrium with the solid phases. The solution phase composition is known as the eutectic. (A) conglomerates show eeeut= 0; (B) racemic compounds show nonzero eeeut.
Figure 6.
Figure 6.
Crystallization from supersaturated solution of achiral molecules that form mirror enantiomorphic solid crystals. (A) Without rapid stirring, equal quantities of left- and right-handed crystals are formed; (B) under rapid stirring conditions, all crystals are grown from the fragments of a single primary crystal (“Eve crystal”), resulting in formation of only one enantiomorph.
Figure 7.
Figure 7.
“Chiral amnesia” process for the evolution of solid-phase homochirality for chiral molecules that form conglomerate solids. In this example, an initial imbalance toward larger l crystals helps to drive the dissolution/re-accretion process from d crystals to l crystals. The process is aided by solution phase racemization, which converts the “excess” dissolved d molecules to l molecules, equalizing the solution composition and enabling molecules that were formerly part of a d crystal to add as l molecules to l crystals.
Scheme 2.
Scheme 2.
Transformation of aspartic acid crystals from one enantiomorphic solid to the other via solution phase racemization. Mechanical or thermal energy input drives the dissolution/re-accretion process.
Figure 8.
Figure 8.
Evolution of solid-phase homochirality for aspartic acid via solution phase racemization. Energy input from grinding the crystals in the presence of enhanced attrition because of glass beads leads to a sigmoidal profile (filled blue circles), whereas thermal energy input drives the process in a linear fashion (open symbols).
Figure 9.
Figure 9.
Manipulation of eutectic ee value by formation of a solvate that reduces the solubility of the racemic compound.
Figure 10.
Figure 10.
Crystal structure of ld proline incorporating one molecule of chloroform. (A) five independent hydrogen bonds are shown; (B) long range structure with proline enantiomers in blue and magenta, chloroform in black (Klussmann et al. 2006).
Scheme 3.
Scheme 3.
Autocatalytic Mannich reaction reported by Tsogoeva.

Similar articles

Cited by

References

    1. Ball P 2007. Giving life a hand. Chem World 4:30–31
    1. Blackmond DG 2004. Asymmetric autocatalysis and its implications for the origin of homochirality. PNAS 101:5732–5736 - PMC - PubMed
    1. Blackmond DG 2006. Mechanistic study of the Soai autocatalytic reaction informed by kinetic analysis. Tetrahedron: Asymmetry 17:584–589
    1. Blackmond DG 2009. The double solubility rule holds for racemizing enantiomers. Chem Eur J 15:3065–3068 - PubMed
    1. Blackmond DG, Klussmann M 2007a. Spoilt for choice: Assessing phase behavior models for the evolution of homochirality. Chem Commun 3990–3996 - PubMed

LinkOut - more resources