. 2010 Aug 20;285(34):25913-27.
doi: 10.1074/jbc.M110.139485. Epub 2010 May 7.

Endothelin-1 (ET-1) increases the expression of remodeling genes in vascular smooth muscle through linked calcium and cAMP pathways: role of a phospholipase A(2)(cPLA(2))/cyclooxygenase-2 (COX-2)/prostacyclin receptor-dependent autocrine loop

Affiliations

Endothelin-1 (ET-1) increases the expression of remodeling genes in vascular smooth muscle through linked calcium and cAMP pathways: role of a phospholipase A(2)(cPLA(2))/cyclooxygenase-2 (COX-2)/prostacyclin receptor-dependent autocrine loop

Karl Deacon et al. J Biol Chem. .

Abstract

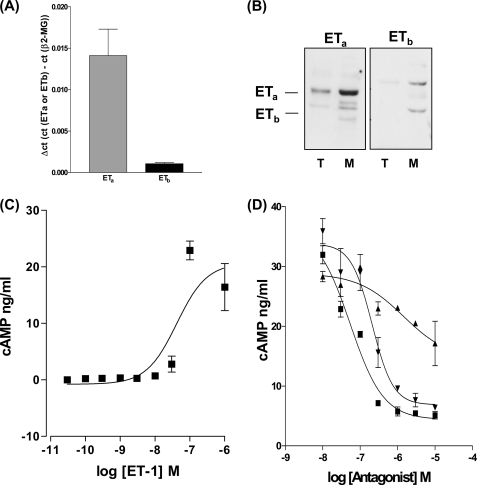
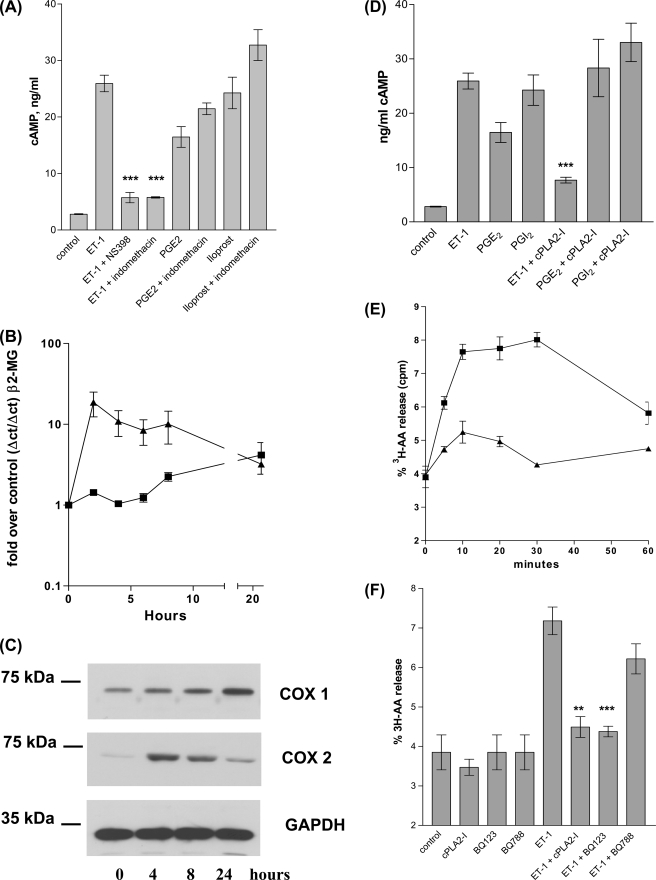
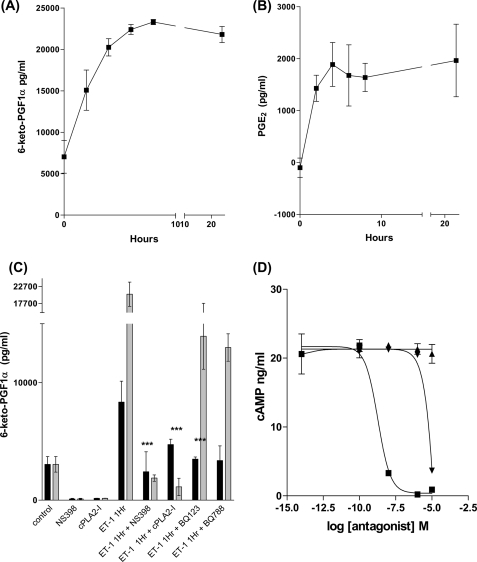
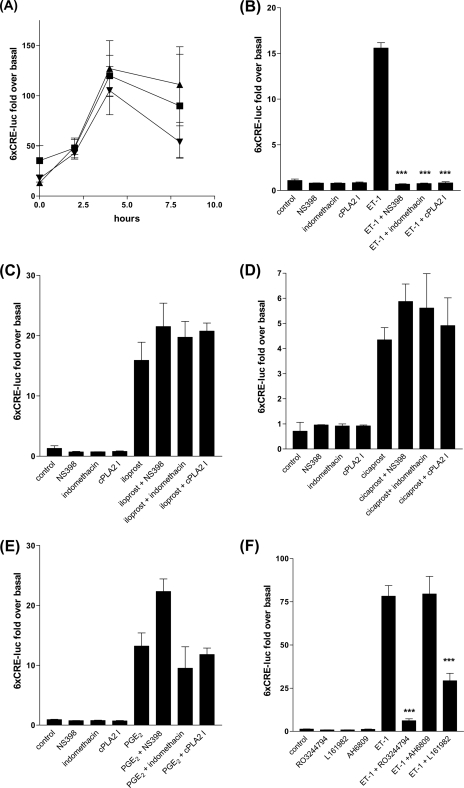
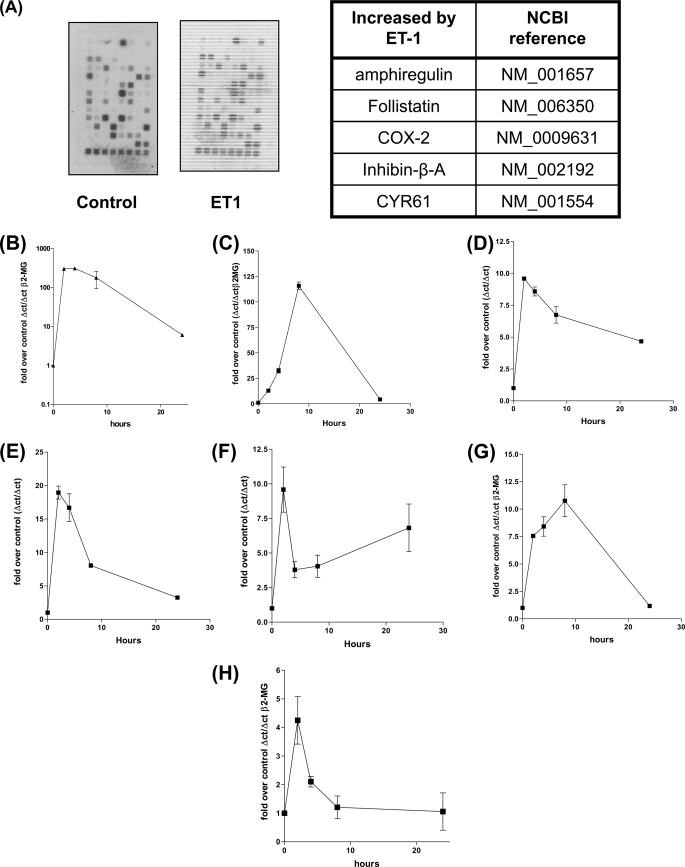
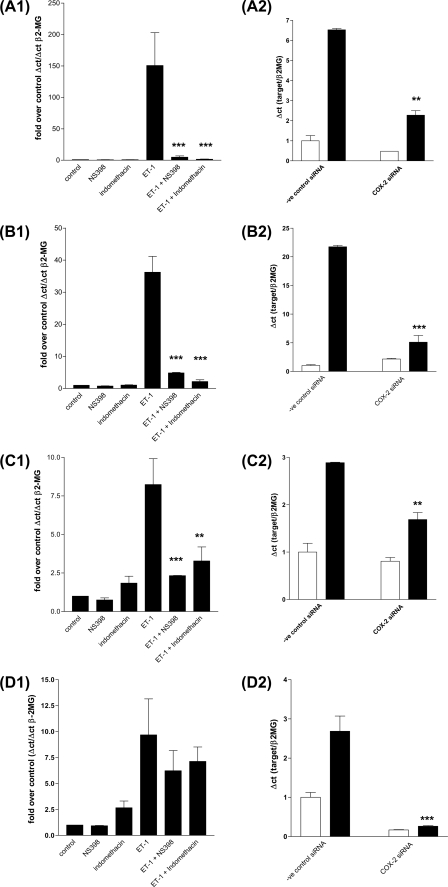
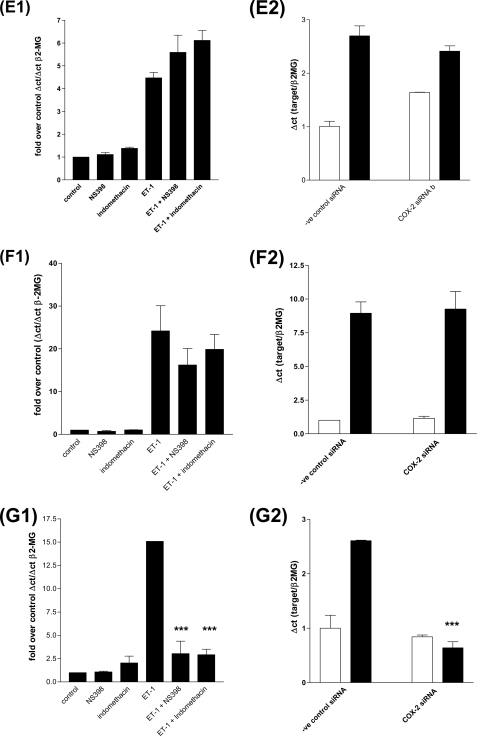
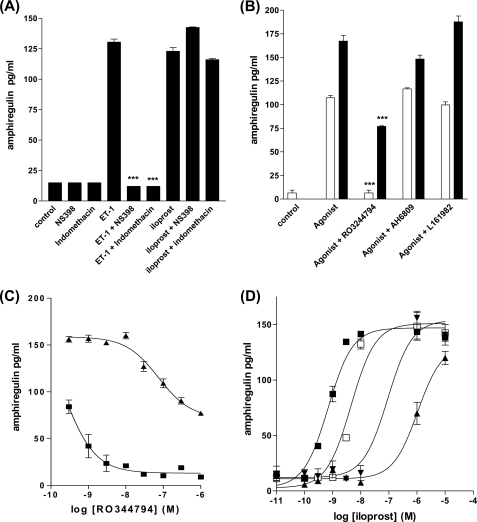
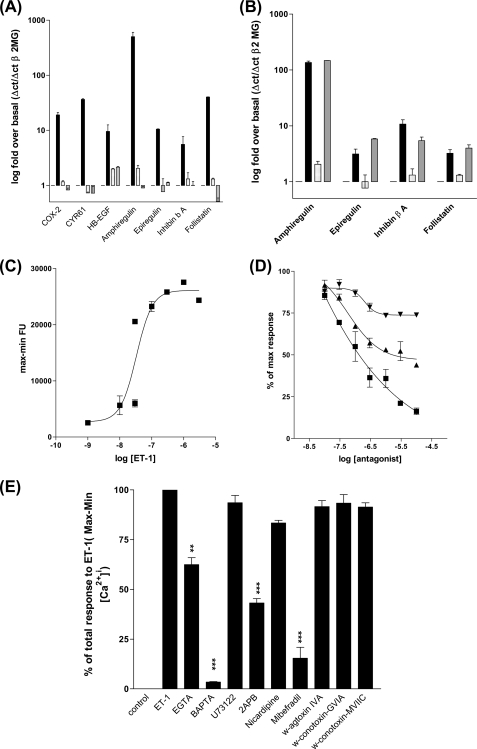
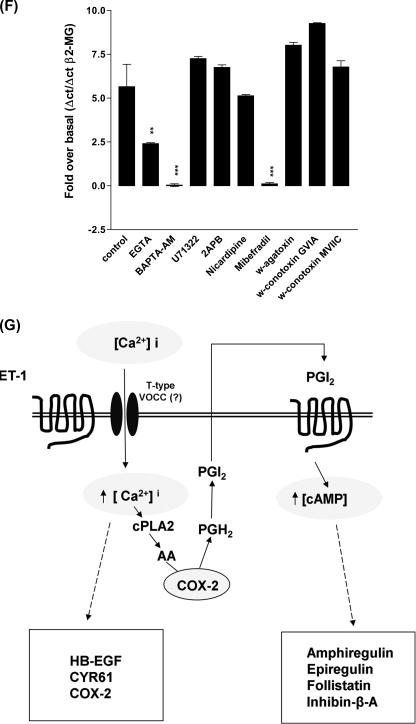
Several important genes that are involved in inflammation and tissue remodeling are switched on by virtue of CRE response elements in their promoters. The upstream signaling mechanisms that inflammatory mediators use to activate cAMP response elements (CREs) are poorly understood. Endothelin (ET) is an important vasoactive mediator that plays roles in inflammation, vascular remodeling, angiogenesis, and carcinogenesis by activating 7 transmembrane G protein-coupled receptors (GPCR). Here we characterized the mechanisms ET-1 uses to regulate CRE-dependent remodeling genes in pulmonary vascular smooth muscle cells. These studies revealed activation pathways involving a cyclooxygenase-2 (COX-2)/prostacyclin receptor (IP receptor) autocrine loop and an interlinked calcium-dependent pathway. We found that ET-1 activated several CRE response genes in vascular smooth muscle cells, particularly COX-2, amphiregulin, follistatin, inhibin-beta-A, and CYR61. ET-1 also activated two other genes epiregulin and HB-EGF. Amphiregulin, follistatin, and inhibin-beta-A and epiregulin were activated by an autocrine loop involving cPLA2, arachidonic acid release, COX-2-dependent PGI(2) synthesis, and IP receptor-linked elevation of cAMP leading to CRE transcription activation. In contrast COX-2, CYR61, and HB-EGF transcription were regulated in a calcium-dependent, COX-2 independent, manner. Observations with IP receptor antagonists and COX-2 inhibitors were confirmed with IP receptor or COX-2-specific small interfering RNAs. ET-1 increases in intracellular calcium and gene transcription were dependent upon ET(a) activation and calcium influx through T type voltage-dependent calcium channels. These studies give important insights into the upstream signaling mechanisms used by G protein-coupled receptor-linked mediators such as ET-1, to activate CRE response genes involved in angiogenesis, vascular remodeling, inflammation, and carcinogenesis.


Figures

FIGURE 1.
FIGURE 1.
HPASMC expresses both ETa and ETb receptors. A, Q-PCR of 10 ng of 1st strand cDNA from HPASMC probed for the ETa receptor and ETb receptors with comparative CtCt) to the β2-microglobulin gene. B, Western blot analysis of 20 μg of total cellular extracts (T) and membrane extracts (M) from HPASMC probed with rabbit anti-ETa and rabbit anti-ETb antibodies. ET-1 causes a concentration-dependent increase in the synthesis of cAMP that is more effectively antagonized by the ETa-specific antagonist BQ123 and the dual specific ETa/ETb antagonist bosentan. C, a concentration range of ET-1 induces cAMP synthesis in HPASMC. D, HPASMC were treated with a concentration curve of ETa antagonist (BQ123) (▾), ETb antagonist (BQ788) (▴), and dual specificity ETa/ETb antagonist (bosentan) (■) for 30 min prior to the 20-min stimulation of cAMP synthesis by ET-1 at 1 × 10⁻⁷ m. All measurements represent the mean ± standard error of three independent experiments.
FIGURE 2.
FIGURE 2.
ET-1 stimulated cellular cAMP synthesis is inhibited by both COX-1/2 and COX-2 selective inhibitors. PGE2 or iloprost stimulation of cAMP synthesis is not inhibited by either COX-1/2 or COX-2 inhibitors. A, HPASMC cells were treated with indomethacin (1 × 10⁻⁶ m) or NS398 (1 × 10⁻⁶ m) for 30 min prior to induction with ET-1 (1 × 10⁻⁸ m) for 20 min, treated cells were then assayed for cAMP. ET-1 stimulates COX-2 mRNA synthesis and COX-2 protein synthesis with peak mRNA at 2 h and peak total protein at 4 h post ET-1 addition. B, HPASMC were treated with a time course of ET-1 (1 × 10⁻⁸ m) for up to 24 h, 1st strand cDNA from total RNA extracts were analyzed by quantitative real time PCR for COX-1 (■) and COX-2 (▴) with reference to the β2-microglobulin gene product. ET-1 stimulates COX-2 protein synthesis in HPASMC. C, HPASMC were treated with ET-1 at 1 × 10⁻⁸ m for up to 24 h, total protein extracts were resolved by SDS-PAGE and the resulting Western blot probed with mouse anti-human-COX-1 or mouse anti-human-COX-2 antibodies. Control blots with identical protein samples were probed with the mouse anti-glyceraldehyde-3-phosphate dehydrogenase antibody. ET-1-stimulated cAMP synthesis is dependent upon cPLA2 activity. PGE2- and iloprost-stimulated cAMP synthesis is not cPLA2 dependent. D, HPASMC was incubated with cPLA2 inhibitor (1 × 10⁻⁷ m) for 30 min prior to incubation with ET-1 (1 × 10⁻⁸ m), PGE2 (1 × 10⁻⁶ m), or iloprost (1 × 10⁻⁸ m) for 20 min. ET-1-stimulated HPASMC were assayed for cAMP. ET-1 stimulates arachidonic acid release from HPASMC. E, HPAMSC incubated with ET-1 (1 × 10⁻⁸ m) (■) or a vehicle control (▴) for a time course of 30 min were assayed for [3H]arachidonic acid release. ET-1 stimulated [3H]arachidonic acid release is inhibited by the Calbiochem cPLA2 inhibitor (cPLA2-I) and the ETa antagonist BQ123. F, HPASMC incubated with cPLA2-I (1 × 10⁻⁷ m), BQ123 (1 × 10⁻⁶ m), or BQ788 (1 × 10⁻⁶ m) for 30 min were then induced for 20 min with ET-1 (1 × 10⁻⁸ m), prior to a [3H]arachidonic acid release assay. All measurements represent the mean ± standard error of three independent experiments. Western blots are representative of three independent experiments.
FIGURE 3.
FIGURE 3.
ET-1 stimulates an increase in PGI2 and PGE2 secretion from HPASMC. HPAMSC were serum starved for 24 h then treated with ET-1 (1 × 10⁻⁸ m) for up to 24 h. Culture supernatants were analyzed for 6-keto-PGF1-α (A) and PGE2 (B) by ELISA. ET-1-stimulated PGI2 synthesis is COX-2 and cPLA2 dependent. HPASMC were serum starved for 24 h, then treated with NS398 (1 × 10⁻⁶ m) or cPLA2-I (1 × 10⁻⁷ m) for 30 min prior to stimulation with ET-1 (1 × 10⁻⁸ m) for either 1 (closed bars) or 8 h (open bars), cell culture supernatants were then assayed for 6-keto-PGF1-α by ELISA (C). ET-1-stimulated HPASMC cAMP synthesis is antagonized by the IP receptor antagonist RO3244794. HPASMC were incubated with a concentration range of RO3244794 (■), AH6809 (▴), or L161982 (▾) for 30 min prior to stimulation with ET-1 (1 × 10⁻⁸ m) for 20 min followed by an assay for cellular cAMP (D). All measurements represent the mean ± standard error of three independent experiments.
FIGURE 4.
FIGURE 4.
ET-1, PGE2, and iloprost can stimulate the 6xCRE-luciferase reporter gene. A, HPASMC grown to 100% confluence and transfected with 0.8 μg of plasmid p6xCRE-LUC and 8 ng of pRL-SV40 after incubation with 2.4 μl of Lipofectamine 2000. Transfected HPASMC were stimulated with a time course of ET-1 (1 × 10⁻⁷ m) for up to 8 h. Firefly luciferase activities were normalized to Renilla luciferase activities from the same transfection replicate. COX1/2, COX-2, and cPLA2 inhibition will completely suppress all ET-1-induced 6xCRE-LUC activity in HPASMC (B), but COX1/2, COX-2, or cPLA2 inhibition will not suppress iloprost (C), cicaprost (D), or PGE2 (E) induced 6xCRE-LUC activity. HPASMC were transfected with 6xCRE-LUC as in A and treated with NS398 (1 × 10⁻⁶ m), indomethacin (1 × 10⁻⁶ m), and the cPLA2 inhibitor (1 × 10⁻⁷ m) for 30 min prior to stimulation with ET-1 (1 × 10⁻⁸ m), iloprost (1 × 10⁻⁸ m), cicaprost (1 × 10⁻⁶ m), or PGE2 (1 × 10⁻⁶ m) for 4 h. The IP receptor antagonist RO3244794 is a more effective inhibitor of ET-1-stimulated 6xCRE-luciferase activity in HPASMC than the EP4 selective antagonist L161982 and the EP1/EP2 antagonist AH6809. HPASMC were transfected with 6xCRE-LUC as for A and pre-treated with 1 × 10⁻⁶ m antagonist for 30 min prior to stimulation with ET-1 (1 × 10⁻⁸ m) for 4 h (F). All measurements represent the mean ± standard error of three experiments.
FIGURE 5.
FIGURE 5.
COX-2, amphiregulin, CYR61, follistatin, inhibin-β-A, epiregulin, and HB-EGF transcription are induced by ET-1 addition to HPASMC. COX-2, amphiregulin, CYR61, inhibin-β-A, and follistatin genes were identified with a CRE gene array probed with biotin-UTP labeled 1st strand cDNA from HPASMC treated with ET-1 for 2 h (A). 5 μg of biotin-UTP labeled 1st strand cDNA was synthesized from total RNA derived from HPASMC serum starved for 24 h and either untreated or treated with ET-1 (1 × 10⁻⁸ m) for 2 h. 2 “CRE gene” cDNA arrays were probed with each probe population with 5 gene cDNAs demonstrating increased hybridization on the ET-1 probe set. Regulation of transcription of amphiregulin (B), follistatin (C), inhibin-β-A (D), COX-2 (E), and CYR61 (F), in response to ET-1, over a time course of 0, 2, 4, 8, and 24 h, was confirmed by Q-PCR against 1st strand cDNA derived from HPASMC treated with ET-1 (1 × 10⁻⁸ m). Primer sets for the EGF family of proteins (EGF, HB-EGF, epiregulin, betacellulin, and transforming growth factor α) were screened by Q-PCR against 1st strand cDNA derived from HPASMC treated with ET-1 (1 × 10⁻⁸ m) for a time course of 0, 2, 4, 8, and 24 h with reference to the β2-microglobulin gene cDNA, epiregulin (G) and HB-EGF (H) transcription is increased in response to ET-1. All measurements (apart from the original CRE array screen) represent the mean ± standard error of three independent experiments.
FIGURE 6.
FIGURE 6.
ET-1 stimulates two classes of transcripts, COX1/2 dependent and COX1/2 independent. HPASMC were serum starved for 24 h. COX-2 inhibitor NS398 (1 × 10⁻⁶ m) or the COX-1/2 inhibitor indomethacin (1 × 10⁻⁶ m) were added for 30 min prior to ET-1 addition (1 × 10⁻⁸ m) for 2 h. Q-PCR was performed against 1st strand cDNA derived from treated cells with reference to the β2-microglobulin gene (β-2MG) cDNA. Q-PCR for amphiregulin (A1), Follistatin (B1), Inhibin-β-A (C1), COX-2 (D1), HB-EGF (E1), CYR61 (F1), and epiregulin (G1). A role for COX-2 in ET-1-induced gene expression was confirmed with COX-2 siRNA and a negative control siRNA, after a 72-h transfection HPASMC were treated with ET-1 (1 × 10⁻⁸ m) for 2 h. Q-PCR was performed against 1st strand cDNA derived from treated cells with reference to the β2-microglobulin gene (β-2MG) cDNA for amphiregulin (A2), Follistatin (B2), Inhibin-β-A (C2), COX-2 (D2), HB-EGF (E2), CYR61 (F2), and epiregulin (G2). All ET-1-induced, COX1/2-dependent genes, amphiregulin (H), epiregulin (I), follistatin (J), and inhibin-β-A (K) undergo increased transcription in response to the addition of PGE2 or PGI2 analogue iloprost to HPASMC. HPASMC were serum starved for 24 h, then treated with ET-1 (1 × 10⁻⁸ m) (■), PGE2 (1 × 10⁻⁶ m) (▴), or iloprost (1 × 10⁻⁸ m) (▾) in a time course of up to 24 h. Q-PCR was performed against 1st strand cDNA derived from treated cells with reference to the β2-microglobulin gene (β-2MG). All measurements represent the mean ± standard error of three independent experiments.
FIGURE 6.
FIGURE 6.
ET-1 stimulates two classes of transcripts, COX1/2 dependent and COX1/2 independent. HPASMC were serum starved for 24 h. COX-2 inhibitor NS398 (1 × 10⁻⁶ m) or the COX-1/2 inhibitor indomethacin (1 × 10⁻⁶ m) were added for 30 min prior to ET-1 addition (1 × 10⁻⁸ m) for 2 h. Q-PCR was performed against 1st strand cDNA derived from treated cells with reference to the β2-microglobulin gene (β-2MG) cDNA. Q-PCR for amphiregulin (A1), Follistatin (B1), Inhibin-β-A (C1), COX-2 (D1), HB-EGF (E1), CYR61 (F1), and epiregulin (G1). A role for COX-2 in ET-1-induced gene expression was confirmed with COX-2 siRNA and a negative control siRNA, after a 72-h transfection HPASMC were treated with ET-1 (1 × 10⁻⁸ m) for 2 h. Q-PCR was performed against 1st strand cDNA derived from treated cells with reference to the β2-microglobulin gene (β-2MG) cDNA for amphiregulin (A2), Follistatin (B2), Inhibin-β-A (C2), COX-2 (D2), HB-EGF (E2), CYR61 (F2), and epiregulin (G2). All ET-1-induced, COX1/2-dependent genes, amphiregulin (H), epiregulin (I), follistatin (J), and inhibin-β-A (K) undergo increased transcription in response to the addition of PGE2 or PGI2 analogue iloprost to HPASMC. HPASMC were serum starved for 24 h, then treated with ET-1 (1 × 10⁻⁸ m) (■), PGE2 (1 × 10⁻⁶ m) (▴), or iloprost (1 × 10⁻⁸ m) (▾) in a time course of up to 24 h. Q-PCR was performed against 1st strand cDNA derived from treated cells with reference to the β2-microglobulin gene (β-2MG). All measurements represent the mean ± standard error of three independent experiments.
FIGURE 7.
FIGURE 7.
Amphiregulin protein secretion from HPASMC is COX-2 dependent. HPASMC were treated with NS398 (1 × 10⁻⁶ m) or indomethacin (1 × 10⁻⁶ m) for 30 min prior to 24 h with ET-1 (1 × 10⁻⁸ m) or iloprost (1 × 10⁻⁸ m) then the culture supernatants were analyzed by ELISA for amphiregulin (A). Endothelin-1 and iloprost induction of amphiregulin protein secretion from HPASMC are inhibited by the IP receptor antagonist RO3244794 but not the EP4 antagonist L161982 or the EP1, EP2, and EP3 antagonist AH6809. HPASMC were treated with RO3244794 (1 × 10⁻⁶ m), L161982 (1 × 10⁻⁶ m), or AH6809 (1 × 10⁻⁶ m) for 30 min prior to stimulation with ET-1 (1 × 10⁻⁸ m) (open bars) or iloprost (1 × 10⁻⁸ m) (closed bars) for 24 h prior to amphiregulin ELISA of the culture supernatants (B). Endothelin-1 and iloprost induction of amphiregulin protein secretion from HPASMC are concentration dependently inhibited by the IP receptor antagonists RO3244794. HPASMC were treated with a concentration range of RO3244794 for 30 min prior to addition of ET-1 (1 × 10⁻⁸ m) (■) or iloprost (1 × 10⁻⁸ m) (▴) for 24 h, culture supernatants were analyzed by ELISA for amphiregulin (C). R03244794 will cause a dextral shift in the iloprost-induced amphiregulin concentration-response curve from HPASMC. HPASMC were treated with a range of RO3244794 (1 × 10⁻⁹ m, □; 1 × 10⁻⁷ m, ▾; 1 × 10⁻⁶ m, ▴) or vehicle control (■) for 30 min prior to the addition of a concentration range of ET-1 (1 × 10⁻⁵ to 1 × 10⁻¹¹ m) at each RO3244794 concentration, the 24-h culture supernatants were analyzed by ELISA for amphiregulin (D). All measurements represent the mean ± standard error.
FIGURE 8.
FIGURE 8.
ET-1/ETa receptor-stimulated intracellular calcium release is required for COX-2 independent, ET-1-induced gene expression but not for PGE2- or iloprost-induced gene expression. HPASMC were treated with inhibitor and agonist combinations and Q-PCR were performed against 1st strand cDNA synthesized from total RNA with primer sets for each gene. A, COX-2, CYR61, HB-EGF, amphiregulin, epiregulin, inhibin-β-A, and follistatin gene expression are induced by ET-1 (1 × 10⁻⁸ m) (0 h, open bar; 2 h, black bar) and blocked by BAPTA-AM (5 × 10⁻⁵ m) preincubation for 30 min (spotted bar for 0 h and gray bar for 2 h post-ET-1 addition). B, amphiregulin, epiregulin, Inhibin-β-A, and follistatin gene expression were induced by iloprost (1 × 10⁻⁸ m) after 2 h (black bar) but not inhibited by preincubation with BAPTA-AM (gray bars) after 2 h. All measurements were performed with reference to the β2-microglobulin gene (β-2MG). All measurements represent the mean ± S.E. of three independent experiments. ET-1 induces intracellular calcium accumulation by stimulating the ETa receptor. HPASMC were incubated with Fluo-4-AM for 30 min with inhibitor or antagonist prior to ET-1 addition followed by measurement of Ca2+/Fluo-4 fluorescence. Data are the difference between minimum and maximum fluorescence response for each treatment. C, there is a concentration/response relationship between ET-1 and the calcium intracellular accumulation. D, the ETa-specific antagonist, BQ123, and the dual ETa/ETb antagonist, bosentan, block ET-1-induced calcium accumulation. ET-1-induced intracellular calcium accumulation and consequent COX-2 gene expression are dependent upon extracellular calcium and the activity of T-type voltage-operated calcium channels. E, the intracellular calcium chelator, BAPTA-AM (5 × 10⁻⁵ m), the N and T-type voltage-operated calcium channel inhibitor, Mibefradil (4 × 10⁻⁵ m) decrease ET-1-induced intracellular calcium accumulation in HPASMC. The phospholipase C inhibitor U73122 (1 × 10⁻⁵ m), L-type voltage-operated calcium channel inhibitor nicardipine (4 × 10⁻⁵ m), N- and P-type voltage-operated calcium channel inhibitor ω-agatoxin-IVA (1 × 10⁻⁸ m), N-type voltage operated calcium channel inhibitor, ω-conotoxin-GVIA (1 × 10⁻⁶ m), and N/P/Q-type voltage-operated calcium channel inhibitor, ω-conotoxin-MVIIC (1 × 10⁻⁶ m) had no effect on ET-1-induced HPASMC intracellular calcium release. HPASMC were loaded with Fluo-4-AM and the relevant inhibitor for 30 min prior to stimulation with ET-1 (1 × 10⁻⁸ m). Measurements are a % of the maximum ET-1-induced response over basal fluorescence. ET-1-induced COX-2 (F) mRNA accumulation is inhibited by calcium chelation, BAPTA-AM, and blockade of T-type voltage-operated calcium channels (no nicardipine block, effective mibefradil block). HPASMC were pretreated with identical concentrations of calcium metabolism inhibitors as in E, for 30 min, prior to stimulation with ET-1 (1 × 10⁻⁸ m) for 2 h. Gene expression was assessed by Q-PCR of the 1st strand cDNA with comparison to the β2-microglobulin gene. All measurements represent the mean ± standard error of three independent experiments. Schematic representation of the interdependent calcium and cAMP second-messenger pathways, linking ET-1 and CRE activity in HPASMC (G).
FIGURE 8.
FIGURE 8.
ET-1/ETa receptor-stimulated intracellular calcium release is required for COX-2 independent, ET-1-induced gene expression but not for PGE2- or iloprost-induced gene expression. HPASMC were treated with inhibitor and agonist combinations and Q-PCR were performed against 1st strand cDNA synthesized from total RNA with primer sets for each gene. A, COX-2, CYR61, HB-EGF, amphiregulin, epiregulin, inhibin-β-A, and follistatin gene expression are induced by ET-1 (1 × 10⁻⁸ m) (0 h, open bar; 2 h, black bar) and blocked by BAPTA-AM (5 × 10⁻⁵ m) preincubation for 30 min (spotted bar for 0 h and gray bar for 2 h post-ET-1 addition). B, amphiregulin, epiregulin, Inhibin-β-A, and follistatin gene expression were induced by iloprost (1 × 10⁻⁸ m) after 2 h (black bar) but not inhibited by preincubation with BAPTA-AM (gray bars) after 2 h. All measurements were performed with reference to the β2-microglobulin gene (β-2MG). All measurements represent the mean ± S.E. of three independent experiments. ET-1 induces intracellular calcium accumulation by stimulating the ETa receptor. HPASMC were incubated with Fluo-4-AM for 30 min with inhibitor or antagonist prior to ET-1 addition followed by measurement of Ca2+/Fluo-4 fluorescence. Data are the difference between minimum and maximum fluorescence response for each treatment. C, there is a concentration/response relationship between ET-1 and the calcium intracellular accumulation. D, the ETa-specific antagonist, BQ123, and the dual ETa/ETb antagonist, bosentan, block ET-1-induced calcium accumulation. ET-1-induced intracellular calcium accumulation and consequent COX-2 gene expression are dependent upon extracellular calcium and the activity of T-type voltage-operated calcium channels. E, the intracellular calcium chelator, BAPTA-AM (5 × 10⁻⁵ m), the N and T-type voltage-operated calcium channel inhibitor, Mibefradil (4 × 10⁻⁵ m) decrease ET-1-induced intracellular calcium accumulation in HPASMC. The phospholipase C inhibitor U73122 (1 × 10⁻⁵ m), L-type voltage-operated calcium channel inhibitor nicardipine (4 × 10⁻⁵ m), N- and P-type voltage-operated calcium channel inhibitor ω-agatoxin-IVA (1 × 10⁻⁸ m), N-type voltage operated calcium channel inhibitor, ω-conotoxin-GVIA (1 × 10⁻⁶ m), and N/P/Q-type voltage-operated calcium channel inhibitor, ω-conotoxin-MVIIC (1 × 10⁻⁶ m) had no effect on ET-1-induced HPASMC intracellular calcium release. HPASMC were loaded with Fluo-4-AM and the relevant inhibitor for 30 min prior to stimulation with ET-1 (1 × 10⁻⁸ m). Measurements are a % of the maximum ET-1-induced response over basal fluorescence. ET-1-induced COX-2 (F) mRNA accumulation is inhibited by calcium chelation, BAPTA-AM, and blockade of T-type voltage-operated calcium channels (no nicardipine block, effective mibefradil block). HPASMC were pretreated with identical concentrations of calcium metabolism inhibitors as in E, for 30 min, prior to stimulation with ET-1 (1 × 10⁻⁸ m) for 2 h. Gene expression was assessed by Q-PCR of the 1st strand cDNA with comparison to the β2-microglobulin gene. All measurements represent the mean ± standard error of three independent experiments. Schematic representation of the interdependent calcium and cAMP second-messenger pathways, linking ET-1 and CRE activity in HPASMC (G).

Similar articles

Cited by

References

    1. Yanagisawa M., Kurihara H., Kimura S., Tomobe Y., Kobayashi M., Mitsui Y., Yazaki Y., Goto K., Masaki T. (1988) Nature 332, 411–415 - PubMed
    1. Woods M., Mitchell J. A., Wood E. G., Barker S., Walcot N. R., Rees G. M., Warner T. D. (1999) Mol. Pharmacol. 55, 902–909 - PubMed
    1. Ehrenreich H., Anderson R. W., Fox C. H., Rieckmann P., Hoffman G. S., Travis W. D., Coligan J. E., Kehrl J. H., Fauci A. S. (1990) J. Exp. Med. 172, 1741–1748 - PMC - PubMed
    1. Suzuki T., Kumazaki T., Mitsui Y. (1993) Biochem. Biophys. Res. Commun. 191, 823–830 - PubMed
    1. Markewitz B. A., Kohan D. E., Michael J. R. (1995) Am. J. Physiol. Lung Cell. Mol. Physiol. 268, L192–L200 - PubMed

Publication types

MeSH terms