. 2010 Jul 16;285(29):22403-13.
doi: 10.1074/jbc.M110.108514. Epub 2010 May 7.

Impaired de novo choline synthesis explains why phosphatidylethanolamine N-methyltransferase-deficient mice are protected from diet-induced obesity

Affiliations

Impaired de novo choline synthesis explains why phosphatidylethanolamine N-methyltransferase-deficient mice are protected from diet-induced obesity

René L Jacobs et al. J Biol Chem. .

Abstract

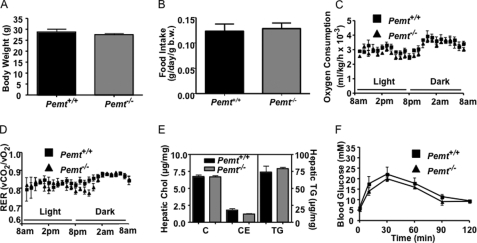
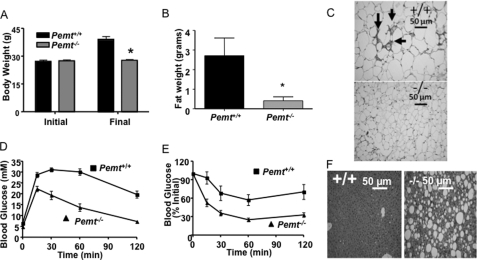
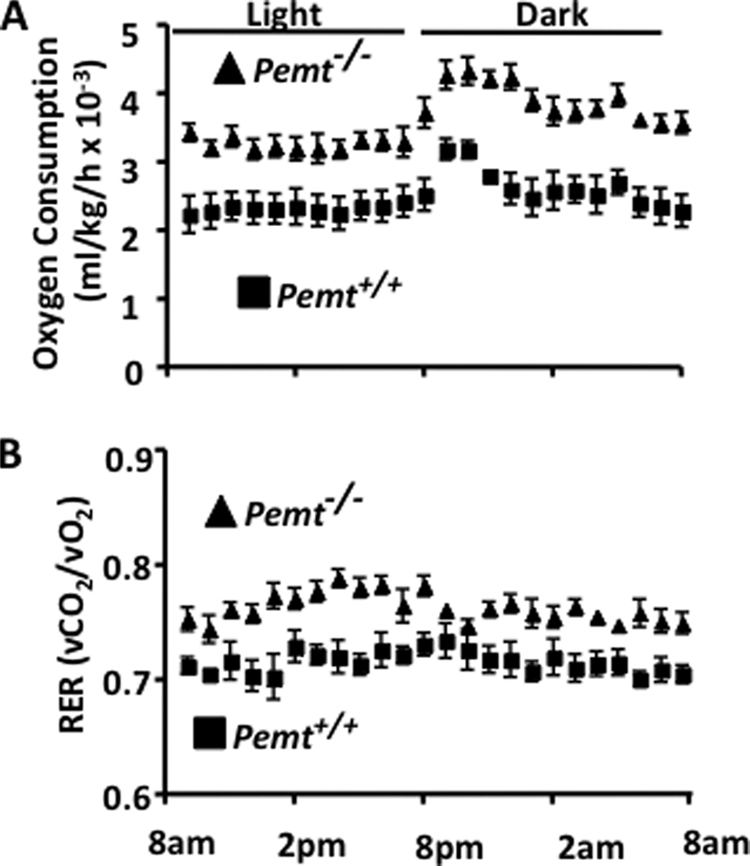
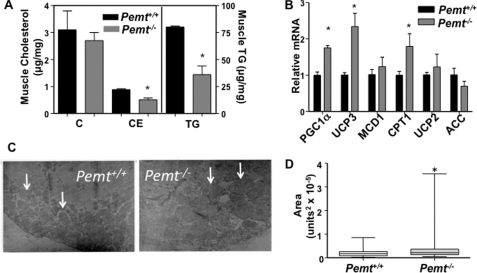
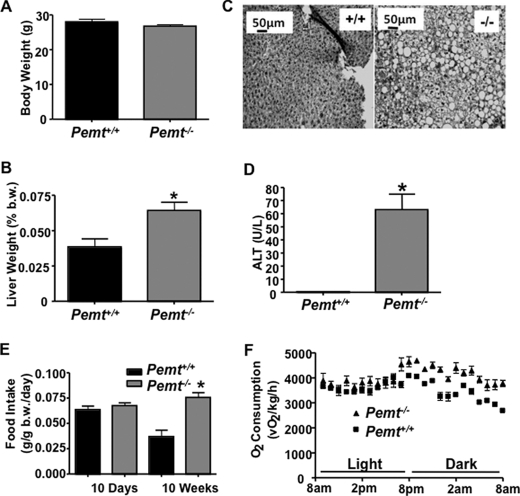
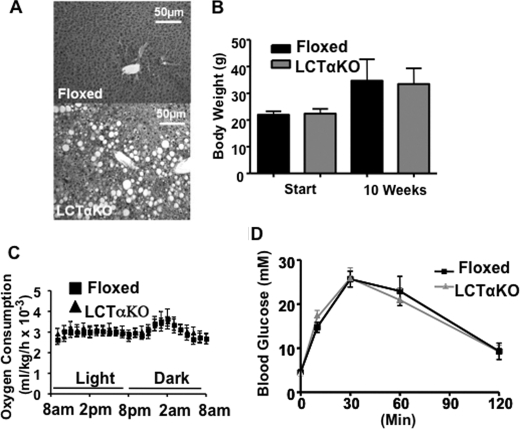
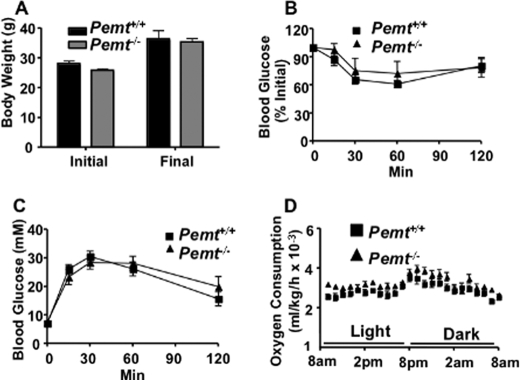
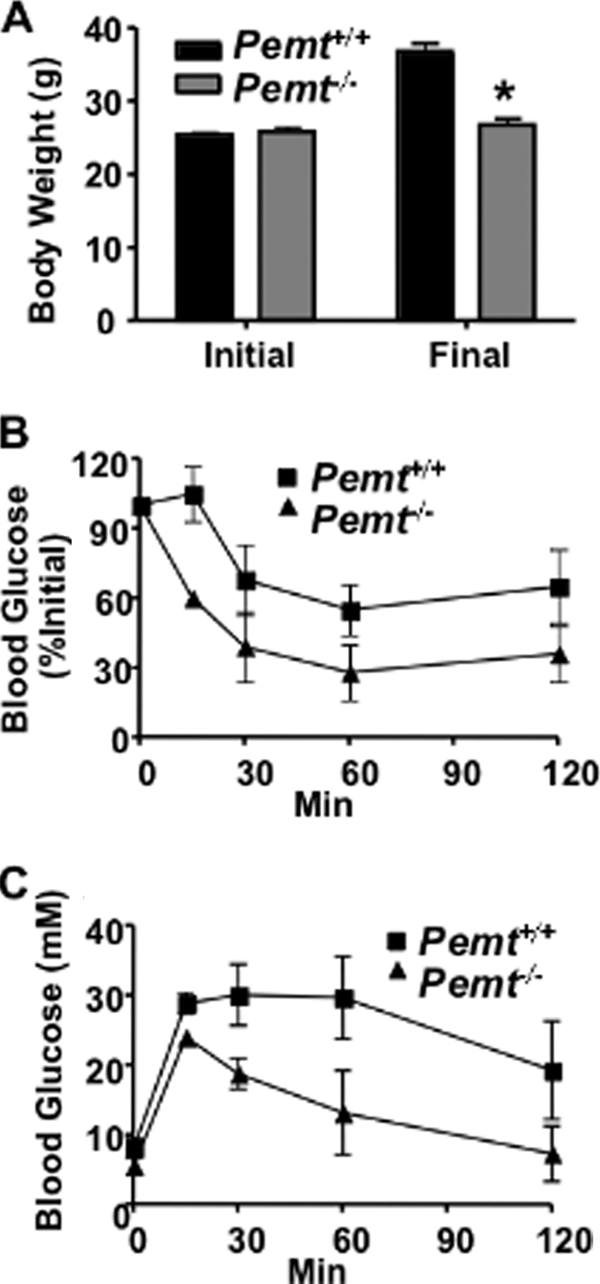
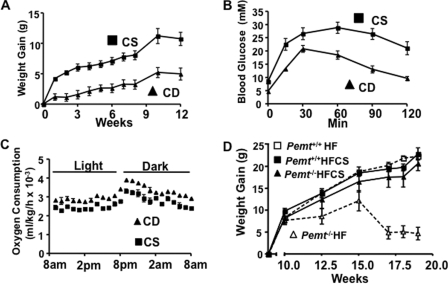
Phosphatidylcholine (PC) is synthesized from choline via the CDP-choline pathway. Liver cells can also synthesize PC via the sequential methylation of phosphatidylethanolamine, catalyzed by phosphatidylethanolamine N-methyltransferase (PEMT). The current study investigates whether or not hepatic PC biosynthesis is linked to diet-induced obesity. Pemt(+/+) mice fed a high fat diet for 10 weeks increased in body mass by 60% and displayed insulin resistance, whereas Pemt(-/-) mice did not. Compared with Pemt(+/+) mice, Pemt(-/-) mice had increased energy expenditure and maintained normal peripheral insulin sensitivity; however, they developed hepatomegaly and steatosis. In contrast, mice with impaired biosynthesis of PC via the CDP-choline pathway in liver became obese when fed a high fat diet. We, therefore, hypothesized that insufficient choline, rather than decreased hepatic phosphatidylcholine, was responsible for the lack of weight gain in Pemt(-/-) mice despite the presence of 1.3 g of choline/kg high fat diet. Supplementation with an additional 2.7 g of choline (but not betaine)/kg of diet normalized energy metabolism, weight gain, and insulin resistance in high fat diet-fed Pemt(-/-) mice. Furthermore, Pemt(+/+) mice that were fed a choline-deficient diet had increased oxygen consumption, had improved glucose tolerance, and gained less weight. Thus, de novo synthesis of choline via PEMT has a previously unappreciated role in regulating whole body energy metabolism.


Figures

FIGURE 1.
FIGURE 1.
Metabolic parameters are normal in Pemt−/− mice fed a chow diet. All data are means ± S.E. A, body weight of 18-week-old male Pemt+/+ and Pemt−/− mice fed the chow diet (n = 4–5). B–F, 16-week-old Pemt+/+ and Pemt−/− mice that had been fed the chow diet (n = 4) were acclimatized for 24 h in an Oxymax Lab Animal Monitoring System and indirect calorimetry measurements were taken every 13 min over a 24-h period. B, food intake (b.w., body weight). C, oxygen consumption. D, respiratory exchange ratio (RER). E, hepatic lipids from male Pemt+/+ and Pemt−/− mice (n = 4–5) were quantified by gas chromatography. C, cholesterol; CE, cholesteryl ester; TG, triacylglycerol. F, glucose tolerance test: chow fed mice (n = 4–5) were injected intraperitoneally with 2 g/kg body weight of glucose, and blood glucose was measured between 15 and 120 min later.
FIGURE 2.
FIGURE 2.
Pemt−/− mice are protected from HF diet-induced obesity and insulin resistance. Data are means ± S.E. A, body weight of 8-week-old male Pemt+/+ and Pemt−/− mice (n = 19–25) before (Initial) and after (Final) being fed the high fat (HF) diet for 10 weeks. B, weight of visceral white adipose tissue in mice fed the HF diet for 10 weeks (n = 6; *, p < 0.001). C, white adipose tissue from 4 Pemt+/+ (upper panel, +/+) and Pemt−/− (lower panel, −/−) mice was fixed in 10% buffered-formalin and stained with hematoxylin and eosin. Arrows indicate the presence of macrophages (dark areas). D, glucose tolerance test: HF diet-fed mice (n = 14–18) were injected intraperitoneally with 2 g/kg body weight of glucose, and blood glucose was measured between 15 and 120 min later. p = 0.002 for Pemt+/+ compared with Pemt−/− mice. E, insulin tolerance test: mice were fed the HF diet for 9 weeks after which 0.8 unit/kg body weight of human insulin was administered by intraperitoneal injection. Blood glucose was measured between 15 and 120 min later (n = 10–13). p < 0.001 for Pemt+/+ compared with Pemt−/− mice. F, histology: tissue was fixed in 10% buffered-formalin and stained with hematoxylin and eosin. A photomicrograph is shown that is representative of four mice of each genotype.
FIGURE 3.
FIGURE 3.
Hypermetabolism protects Pemt−/− mice from HF diet-induced weight gain. All data are presented as means ± S.E. 8-week-old, male Pemt+/+ and Pemt−/− mice that had been fed the HFD diet (n = 8–10) for 8 weeks were acclimatized for 24 h in an Oxymax Lab Animal Monitoring System, and indirect calorimetry measurements were taken every 13 min over a 24-h period. A, oxygen consumption (p < 0.001). B, respiratory exchange ratio (RER) (p < 0.05).
FIGURE 4.
FIGURE 4.
Reduced neutral lipid storage in gastrocnemius muscle of HF diet-fed Pemt−/− mice. Whole gastrocnemius muscles were removed from HF diet-fed Pemt+/+ and Pemt−/− mice that had been fasted overnight. A, neutral lipids (C, cholesterol; CE, cholesteryl ester; and TG, triacylglycerol) were quantified by gas chromatography; *, p < 0.05. B, the relative levels of mRNA-encoding genes involved in fatty acid metabolism were determined by real-time quantitative PCR. Data are relative to cyclophilin mRNA in the same sample (n = 4). *, p < 0.05. PGC1α, PPARγ co-activator; UCP, uncoupling protein; MCD1, malonyl-CoA decarboxylase 1; CPT1, carnitine palmitoyl-CoA transferase 1; ACC, acetyl-CoA carboxylase. C, transmission electron microscope images of mitochondria (some indicated by arrows) in gastrocnemius muscle (10,000-fold magnification). D, the size of individual mitochondria (n = 70–100) was quantified using ImageJ software and is displayed using a box and whiskers plot (p < 0.05).
FIGURE 5.
FIGURE 5.
Pemt−/− mice fed the HF diet develop hypermetabolism and hepatic steatosis prior to changes in body weight. A, body weight of male 8-week-old Pemt+/+ and Pemt−/− mice (n = 4–5) was measured after 14 days of HF diet feeding. B, liver weight was measured as % of total body weight (b.w.) in overnight-fasted mice after 14 days of HF-diet feeding. C, liver histology: liver tissue was fixed in 10% buffered-formalin and stained with hematoxylin and eosin. D, plasma alanine aminotransferase (ALT) levels were measured in blood from fasted mice (n = 4–5). *, p < 0.05 after 14 days of HF diet feeding. E, food intake (g/g body weight/day) of male Pemt+/+ and Pemt−/− mice (n = 4–5) following 10 days or 10 weeks of HF-diet feeding. *, p < 0.05. F, oxygen consumption of Pemt+/+ and Pemt−/− mice fed a HF diet for 10 days (n = 4–5) were measured using indirect calorimetry.
FIGURE 6.
FIGURE 6.
CTαLKO mice are not protected from HF diet-induced obesity. Data are means ± S.E. A, liver histology: tissue was fixed in 10% buffered-formalin and stained with hematoxylin and eosin. A representative picture of liver sections from four individual mice/group is shown. B, body weight of 8-week-old male floxed (control) and CTαLKO mice (n = 6) before and after being fed the HF diet for 10 weeks. C, oxygen consumption: male floxed and CTαLKO mice (n = 6) that had been fed the HF diet for 8 weeks were acclimatized for 24 h in an Oxymax Lab Animal Monitoring System, and indirect calorimetry measurements were taken every 13 min over a 24-h period. D, glucose tolerance test: 2 g of glucose/kg of body weight was administered by intraperitoneal injection to mice (n = 6) that had been fed the HF diet for 9 weeks. Blood glucose was measured at indicated times.
FIGURE 7.
FIGURE 7.
Metabolic phenotype of Pemt−/− mice fed the HF diet is reversed by choline supplementation. Data are means ± S.E. A, body weight of 8-week-old male Pemt+/+ and Pemt−/− mice (n = 8–12) before (Initial) and after (Final) being fed the HFCS diet for 10 weeks. B, insulin tolerance test: 0.8 unit/kg body weight of human insulin was administered to mice that had been fed the HFCS diet for 9 weeks by intraperitoneal injection. Blood glucose was measured (n = 10–12). C, glucose tolerance test: 2 g of glucose/kg of body weight was administered by intraperitoneal injection to mice that had been fed the HFCS diet for 9 weeks. Blood glucose was measured (n = 8–12). D, oxygen consumption: Pemt+/+ and Pemt−/− mice that had been fed the HFCS diet for 8 weeks (n = 5) were acclimatized for 24 h in an Oxymax Lab Animal Monitoring System, and indirect calorimetry measurements were taken every 13 min over a 24-h period.
FIGURE 8.
FIGURE 8.
Betaine supplementation does not induce weight gain or insulin resistance in Pemt−/− mice fed the HF diet. A, body weight of 8-week-old male Pemt+/+ and Pemt−/− mice (n = 10–12) before (Initial) and after (Final) the mice were fed the HF-betaine-supplemented diet for 10 weeks (*, p < 0.001). B and C, after the mice had been fed the HF-betaine-supplemented diet for 9 weeks (B) insulin and (C) glucose tolerance tests were performed (n = 8–12). p < 0.01.
FIGURE 9.
FIGURE 9.
Attenuated weight gain, increased oxygen consumption, and improved glucose tolerance in Pemt+/+ mice fed the choline-deficient diet. Data are means ± S.E. 8-week-old male Pemt+/+ mice (n = 6) were fed a choline-supplemented (CS) or choline-deficient (CD) diet for 12 weeks. A, weight of the mice was measured at indicated times (p < 0.01). B, glucose tolerance test: 2 g of glucose/kg of body weight was administered by intraperitoneal injection, and blood glucose was measured after 15, 30, 60, and 120 min (n = 6; p < 0.0001). C, oxygen consumption (p < 0.0001) was measured in Pemt+/+ mice that had been fed the CS or CD diet for 9 weeks. D, weight gain of 8-week-old male Pemt+/+ and Pemt−/− mice that had been fed either the HF diet or the HFCS diet for 10 weeks after a 10-week HF/CS feeding period (n = 5–8).

References

    1. Muoio D. M., Newgard C. B. (2006) Annu. Rev. Biochem. 75, 367–401 - PubMed
    1. Kalaany N. Y., Gauthier K. C., Zavacki A. M., Mammen P. P., Kitazume T., Peterson J. A., Horton J. D., Garry D. J., Bianco A. C., Mangelsdorf D. J. (2005) Cell Metab. 1, 231–244 - PubMed
    1. Hubbard B., Doege H., Punreddy S., Wu H., Huang X., Kaushik V. K., Mozell R. L., Byrnes J. J., Stricker-Krongrad A., Chou C. J., Tartaglia L. A., Lodish H. F., Stahl A., Gimeno R. E. (2006) Gastroenterology 130, 1259–1269 - PubMed
    1. Pospisilik J. A., Knauf C., Joza N., Benit P., Orthofer M., Cani P. D., Ebersberger I., Nakashima T., Sarao R., Neely G., Esterbauer H., Kozlov A., Kahn C. R., Kroemer G., Rustin P., Burcelin R., Penninger J. M. (2007) Cell 131, 476–491 - PubMed
    1. Uno K., Katagiri H., Yamada T., Ishigaki Y., Ogihara T., Imai J., Hasegawa Y., Gao J., Kaneko K., Iwasaki H., Ishihara H., Sasano H., Inukai K., Mizuguchi H., Asano T., Shiota M., Nakazato M., Oka Y. (2006) Science 312, 1656–1659 - PubMed

Publication types

MeSH terms