. 2010 Jul 9;285(28):21750-67.
doi: 10.1074/jbc.M110.101311. Epub 2010 May 7.

Rab3-interacting molecule gamma isoforms lacking the Rab3-binding domain induce long lasting currents but block neurotransmitter vesicle anchoring in voltage-dependent P/Q-type Ca2+ channels

Affiliations

Rab3-interacting molecule gamma isoforms lacking the Rab3-binding domain induce long lasting currents but block neurotransmitter vesicle anchoring in voltage-dependent P/Q-type Ca2+ channels

Yoshitsugu Uriu et al. J Biol Chem. .

Abstract

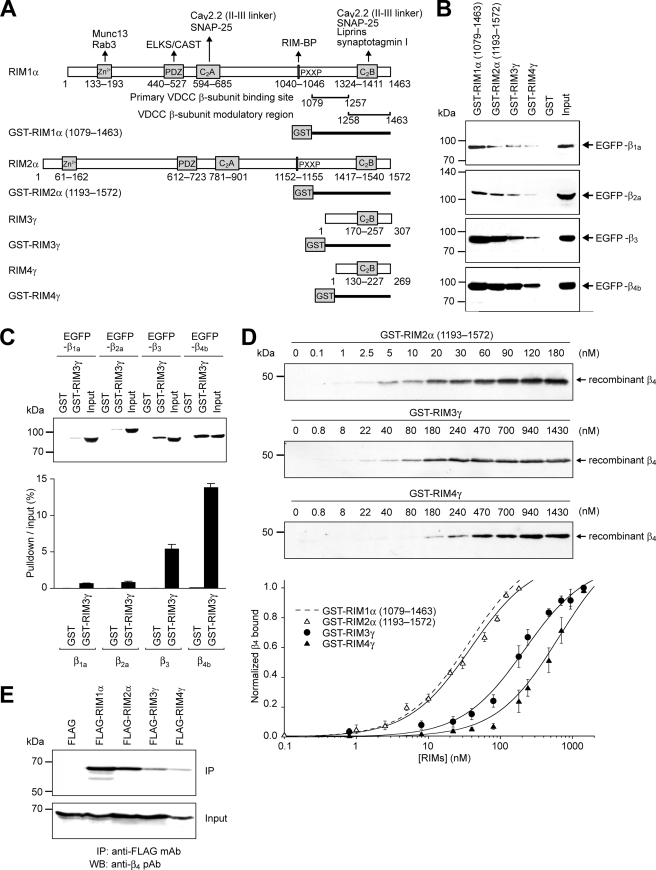
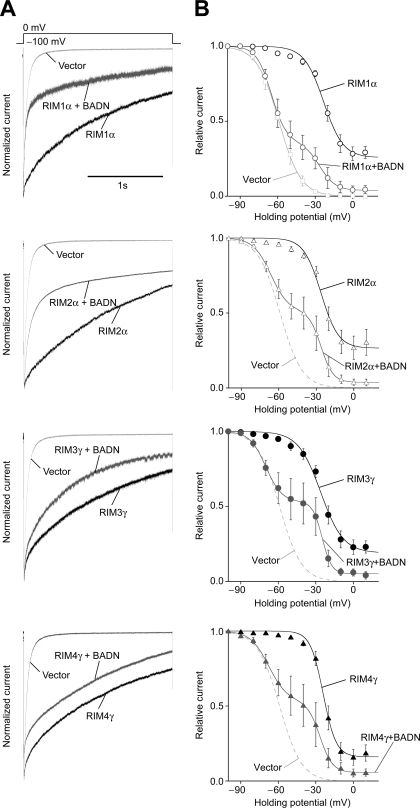
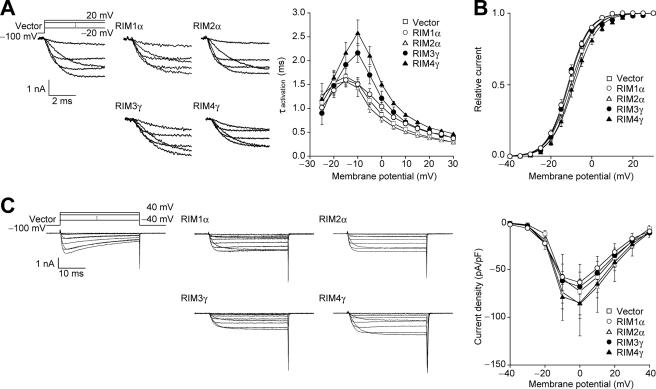
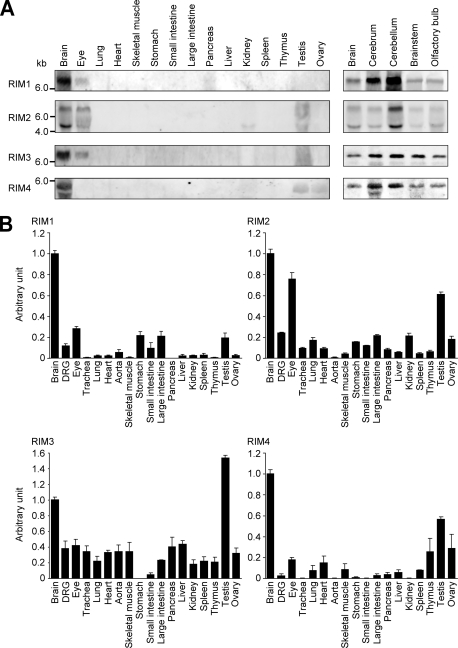
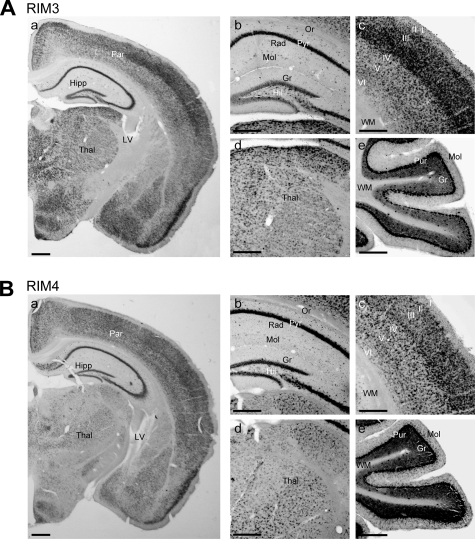
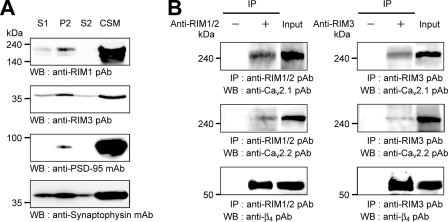
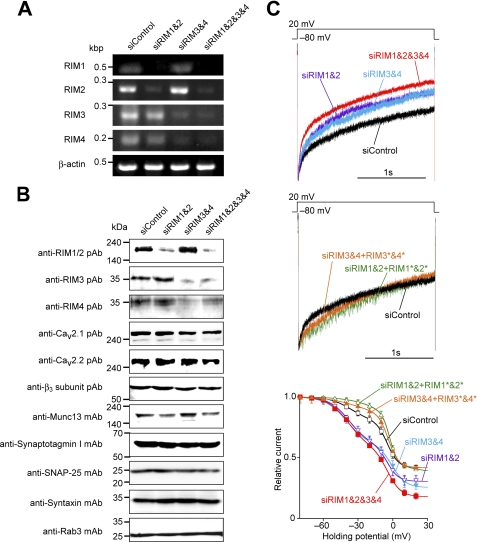
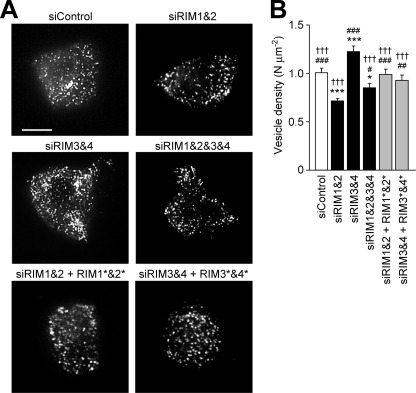
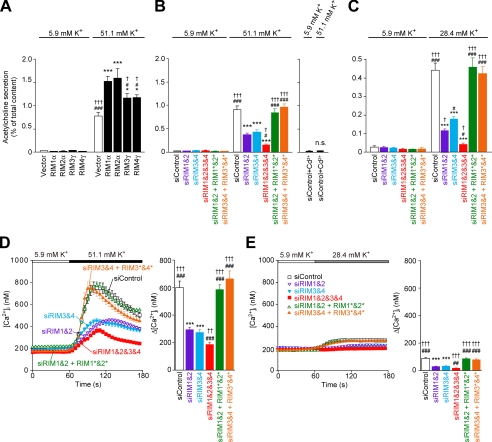
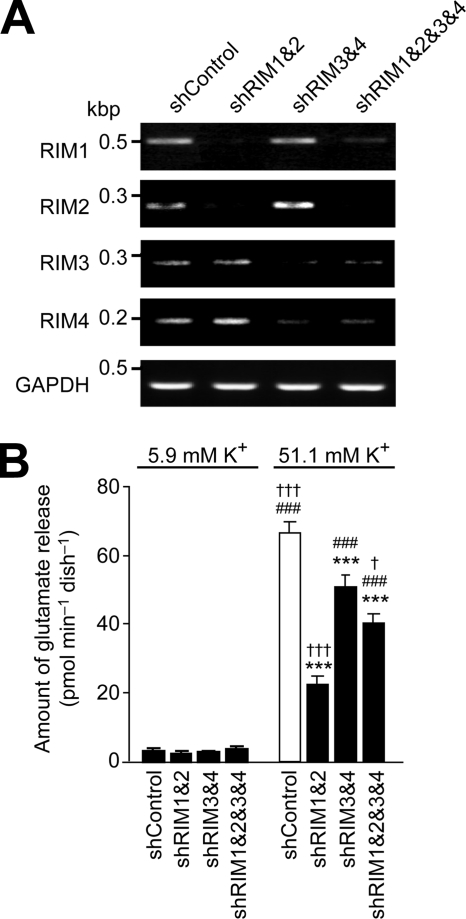
Assembly of voltage-dependent Ca(2+) channels (VDCCs) with their associated proteins regulates the coupling of VDCCs with upstream and downstream cellular events. Among the four isoforms of the Rab3-interacting molecule (RIM1 to -4), we have previously reported that VDCC beta-subunits physically interact with the long alpha isoform of the presynaptic active zone scaffolding protein RIM1 (RIM1alpha) via its C terminus containing the C(2)B domain. This interaction cooperates with RIM1alpha-Rab3 interaction to support neurotransmitter exocytosis by anchoring vesicles in the vicinity of VDCCs and by maintaining depolarization-triggered Ca(2+) influx as a result of marked inhibition of voltage-dependent inactivation of VDCCs. However, physiological functions have not yet been elucidated for RIM3 and RIM4, which exist only as short gamma isoforms (gamma-RIMs), carrying the C-terminal C(2)B domain common to RIMs but not the Rab3-binding region and other structural motifs present in the alpha-RIMs, including RIM1alpha. Here, we demonstrate that gamma-RIMs also exert prominent suppression of VDCC inactivation via direct binding to beta-subunits. In the pheochromocytoma PC12 cells, this common functional feature allows native RIMs to enhance acetylcholine secretion, whereas gamma-RIMs are uniquely different from alpha-RIMs in blocking localization of neurotransmitter-containing vesicles near the plasma membrane. Gamma-RIMs as well as alpha-RIMs show wide distribution in central neurons, but knockdown of gamma-RIMs attenuated glutamate release to a lesser extent than that of alpha-RIMs in cultured cerebellar neurons. The results suggest that sustained Ca(2+) influx through suppression of VDCC inactivation by RIMs is a ubiquitous property of neurons, whereas the extent of vesicle anchoring to VDCCs at the plasma membrane may depend on the competition of alpha-RIMs with gamma-RIMs for VDCC beta-subunits.


Figures

FIGURE 1.
FIGURE 1.
Direct interaction of RIMs with VDCC β-subunits. A, domain structures and GST fusion constructs of mouse RIMs. The arrows indicate molecules interacting with RIM1 at the following domains: Zn2+ finger-like domain (Zn2+), PDZ domain (PDZ), first and second C2 domains (C2A and C2B), and proline-rich region (PXXP). Primary VDCC β-subunit binding site (RIM1α(1079–1257)) and VDCC β-subunit modulatory region (RIM1α(1258–1463)) are indicated according to Ref. . B, pull-down assay of β-subunits with GST fusion RIM constructs. GST fusion proteins immobilized on glutathione-Sepharose beads were incubated with cell lysates obtained from EGFP-β-transfected HEK293T cells. Bound proteins were analyzed by WB using antibody for GFP. C, a comparison of RIM3γ binding affinity among VDCC β-subunits. Top, β-subunits were analyzed by GST pull-down using GST- or GST-RIM3γ-coated beads. Input is 10% of the amount used for pull-down. Bottom, quantification of pull-down results (mean ± S.E. (error bars) of three experiments). D, in vitro association between the purified GST-RIM fusion constructs and recombinant β4-subunit (amino acid residues 47–475). GST-RIM proteins at various concentrations, incubated with β4 (50 pm), were captured by glutathione-Sepharose beads. Captured β4-proteins were examined by WB. The lower panel shows the quantitative densitometric analysis of bands shown in the upper panels. The saturation curves were subjected to the nonlinear least squares curve-fitting method to evaluate the apparent Kd. The saturation curves for GST-RIM1α(1079–1463) were adapted from Kiyonaka et al. (12). E, interactions of recombinant β4b and RIMs in HEK293T cells. The interactions were evaluated by immunoprecipitation (IP) with antibody for FLAG, followed by WB with antibody for β4.
FIGURE 2.
FIGURE 2.
Effects of RIMs on the inactivation properties of P/Q-type CaV2.1 channels. A, effects of RIMs and BADN on inactivation of P/Q-type CaV2.1 currents in BHK cells expressing α2/δ and β1a-subunit. The peak amplitudes are normalized for Ba2+ currents elicited by 2-s pulses to 0 mV from a Vh of −100 mV. B, effects of RIMs and BADN on voltage dependence of inactivation of CaV2.1. To determine the voltage dependence of inactivation, currents were evoked by a 20-ms test pulse to 5 mV after the 10-ms repolarization to −100 mV following 2-s Vh displacements (conditioning pulses) from −100 to 20 mV with 10-mV increments. See supplemental Table S2 for statistical significance of the differences. Error bars, S.E.
FIGURE 3.
FIGURE 3.
Effects of RIMs on the activation properties of P/Q-type CaV2.1. A, activation kinetics of P/Q-type CaV2.1 currents in BHK cells expressing α2/δ- and β1a-subunit. Left, families of representative Ba2+ currents. Currents evoked by 5-ms step depolarization from −20 to 20 mV in 10-mV increments from a Vh of −100 mV are displayed. Right, activation time constants plotted as a function of test potential. The activation phases are well fitted by a single exponential function at all potentials. Activation time constants (τactivation) were obtained from currents elicited by 5-ms step depolarization from −25 to 30 mV in 5-mV increments from a Vh of −100 mV. B, activation curves of P/Q-type CaV2.1 currents. Tail currents elicited by repolarization to −60 mV after 5-ms test pulses from −40 to 30 mV were used to determine activation curves. C, effects of RIMs on P/Q-type CaV2.1 currents. Left, representative traces for Ba2+ currents on application of test pluses from −40 to 40 mV with 10-mV increments from a Vh of −100 mV. Right, current density-voltage (I-V) relationships of CaV2.1. See supplemental Table S3 for statistical significance of the differences. Error bars, S.E.
FIGURE 4.
FIGURE 4.
Tissue distribution of RIMs. A, Northern blot analyses show the tissue distribution of RIM1, RIM2, RIM3, and RIM4 RNAs. Positions of molecular size markers are identified on the left. B, real-time PCR analyses of the tissue distribution of RIM1, RIM2, RIM3, and RIM4 RNAs. The expression levels of RIM RNAs are normalized to those of 18 S. The results are expressed relative to the brain given the arbitrary value of 1 and are means ± S.E. (error bars) of at least three independent experiments.
FIGURE 5.
FIGURE 5.
Distribution of RIM3 and RIM4 RNA in the brain. In situ hybridization photomicrographs show expression of RIM3 (A) and RIM4 (B) RNA in the forebrain (A (a) and B (a)), hippocampal formation (A (b) and B (b)), cerebral cortex (A (c) and B (c)), thalamus (A (d) and B (d)), and cerebellar cortex (A (e) and B (e)). I–VI, layers of cerebral cortex; Gr, granule cell layer of dentate gyrus (A (b) and B (b)) or cerebellar cortex (A (e) and B (e)); Hil, hilar region of hippocampal formation; Hipp, hippocampus; LV, lateral ventricle; Mol, stratum lacunosum-moleculare of hippocampal CA1 (A (b) and B (b)) or molecular cell layer of cerebellar cortex (A (e) and B (e)); Or, stratum orien; Par, parietal cortex; Pyr, stratum pyramidale; Rad, stratum radiatum; Thal, thalamus; WM, white matter. Scale bars, 500 μm in A (a) and B (a); 50 μm in A (b–e) and B (b–e).
FIGURE 6.
FIGURE 6.
Association of RIMs with native neuronal VDCC complexes in CSM fraction. A, subcellular fractionation. The homogenate of mouse brain was subjected to subcellular fractionation. An aliquot of each fraction (10 μg of protein each) was analyzed by WB with the indicated antibodies. S1, crude synaptosomal fraction; P2, crude membrane fraction; S2, cytosolic synaptosomal fraction; CSM, CSM fraction. B, coimmunoprecipitation of RIMs with the VDCC subunits. Immunoprecipitation (IP) using an antibody for RIMs and subsequent WB for CaV2.1, CaV2.2, and β4 was carried out on the CSM fraction.
FIGURE 7.
FIGURE 7.
Physiological relevance of effects of RIMs on inactivation properties of VDCCs. A, RT-PCR analysis of RIM1, RIM2, RIM3, and RIM4 RNA expression in PC12 cells treated with GAPDH siRNA (siControl), a combination of RIM1- and RIM2-specific siRNAs (siRIM1&2), a combination of RIM3- and RIM4-specific siRNAs (siRIM3&4), and a combination of RIM1-, RIM2-, RIM3-, and RIM4-specific siRNAs (siRIM1&2&3&4). PCR was performed for 29 cycles. β-Actin was used as an internal control. B, WB of essential components of release machinery and VDCC subunits in PC12 cells transfected with the indicated combination of siRNAs. Primary antibodies used are indicated on the left. C, acceleration of inactivation by application of siRNAs specific for RIMs in VDCC currents recorded from PC12 cells. The acceleration of inactivation in RIM knockdown cells was reversed by expression of siRNA-resistant RIM cDNAs (siRIM1&2 + RIM1*&2*, and siRIM3&4 + RIM3*&4*). Top and middle, normalized current traces. Bottom, inactivation curves. See supplemental Table S4 for statistical significance of the differences.
FIGURE 8.
FIGURE 8.
γ-RIMs reduce the density of vesicles at the plasma membrane in PC12 cells. A, typical TIRF images of plasma membrane-docked vesicles containing NPY-Venus are shown. NPY-Venus and combinations of siRNAs and siRNA-resistant RIM cDNAs were cotransfected in PC12 cells, and live images of cells were obtained by TIRF microscopy. Scale bar, 10 μm. B, the vesicle density (number (N) μm−2) was determined by counting the vesicles in each image. The number of individual fluorescent spots in the area, where vesicles uniformly distributed in TIRF images, was divided by the area. Numbers of PC12 cells analyzed were 48, 51, 40, 45, 30, and 29 for transfection of siControl, siRIM1&2, siRIM3&4, siRIM1&2&3&4, siRIM1&2 + RIM1*&2*, and siRIM3&4 + RIM3*&4*, respectively. *, p < 0.05; ***, p < 0.001 versus siControl. #, p < 0.05; ##, p < 0.01; and ###, p < 0.001 versus siRIM1&2. †††, p < 0.001 versus siRIM3&4. Error bars, S.E.
FIGURE 9.
FIGURE 9.
γ-RIMs enhance neurotransmitter release less potently than α-RIMs in PC12 cells. A, effects of recombinant RIMs on depolarization-dependent release of ACh from ChAT-cotransfected PC12 cells. Transfected PC12 cells are incubated for 30 s with 5.9 mm K+ solution at 37 °C. The release of ACh during this period is considered to be basal release. To measure depolarization-induced ACh release, the cells are then incubated for 30 s with 51.1 mm K+ solution. The amount of secreted ACh was determined as a percentage of the cellular content for each dish. The numbers of experiments performed were 12, 10, 11, 10, and 12 for transfection of vector, RIM1α, RIM2α, RIM3γ, and RIM4γ, respectively. *, p < 0.05; ***, p < 0.001 versus vector. #, p < 0.05; ###, p < 0.001 versus RIM1α. †, p < 0.05; †††, p < 0.001 versus RIM2α. B (left), effects of siRNA for RIMs on depolarization-dependent release of ACh from ChAT-cotransfected PC12 cells. The numbers of experiments performed were 12, 12, 11, 6, 9, and 11 for transfection of siControl, siRIM1&2, siRIM3&4, siRIM1&2&3&4, siRIM1&2 + RIM1*&2*, and siRIM3&4 + RIM3*&4*, respectively. ***, p < 0.001 versus siControl. #, p < 0.05; ###, p < 0.001 versus siRIM1&2. †, p < 0.05; †††, p < 0.001 versus siRIM3&4. Right, effects of 0.3 mm Cd2+ on depolarization-dependent release of ACh from ChAT-cotransfected PC12 cells. The number of experiments performed was 4. n.s., not significant. C, effects of siRNA for RIMs on moderate depolarization-dependent release of ACh from ChAT-cotransfected PC12 cells. To measure ACh release, the cells were incubated for 120 s with a 28.4 mm K+ solution. The numbers of experiments performed were 9, 10, 11, 7, 7, and 11 for transfection of siControl, siRIM1&2, siRIM3&4, siRIM1&2&3&4, siRIM1&2 + RIM1*&2*, and siRIM3&4 + RIM3*&4*, respectively. ***, p < 0.001 versus siControl. #, p < 0.05; ###, p < 0.001 versus siRIM1&2. †, p < 0.05; †††, p < 0.001 versus siRIM3&4. D, effects of siRIMs on Ca2+ responses upon elevation of extracellular K+ concentration from 5.9 to 51.1 mm. Average time courses (left) and maximal [Ca2+]i rises (right) are shown. Numbers of PC12 cells analyzed were 46, 85, 90, 72, 45, and 49 for transfection of siControl, siRIM1&2, siRIM3&4, siRIM1&2&3&4, siRIM1&2 + RIM1*&2*, and siRIM3&4 + RIM3*&4*, respectively. ***, p < 0.001 versus siControl. ###, p < 0.001 versus siRIM1&2. ††, p < 0.01; †††, p < 0.001 versus siRIM3&4. E, effects of siRIMs on Ca2+ responses upon elevation of extracellular K+ concentration from 5.9 to 28.4 mm. Numbers of PC12 cells analyzed were 80, 92, 90, 97, 49, and 66 for transfection of siControl, siRIM1&2, siRIM3&4, siRIM1&2&3&4, siRIM1&2 + RIM1*&2*, and siRIM3&4 + RIM3*&4*, respectively. ***, p < 0.001 versus siControl. ##, p < 0.01; ###, p < 0.001 versus siRIM1&2. †††, p < 0.001 versus siRIM3&4. Error bars, S.E.
FIGURE 10.
FIGURE 10.
γ-RIMs support neurotransmitter release in cerebellar neurons. A, RT-PCR analysis of RNA expression of RIMs in cultured cerebellar neurons treated with a negative control shRNA vector (shControl), combination of RIM1- and RIM2-targeted shRNA vectors (shRIM1&2), combination of RIM3- and RIM4-targeted shRNA vectors (shRIM3&4), and combination of RIM1-, RIM2-, RIM3-, and RIM4-targeted shRNA vectors (shRIM1&2&3&4). GAPDH was used as an internal control. PCR was performed 26 cycles for RIM1, 30 cycles for RIM2, 36 cycles for RIM3, 36 cycles for RIM4, 30 cycles for GAPDH. B, effects of shRNA for RIMs on depolarization-dependent release of glutamate from cultured cerebellar neurons. Cultured cerebellar neurons transfected with shRNA vectors (10 DIV) were incubated for 1 min with the low K+ solution (5.9 mm K+) at 37 °C. The release of glutamate during this period was considered to be basal release. To measure glutamate release, the cells were then incubated for 1 min with a high K+ solution (51.1 mm K+). Numbers of experiments performed were 11, 11, 16, and 11 for transfection of shControl, shRIM1&2, shRIM3&4, and shRIM1&2&3&4, respectively. ***, p < 0.001 versus shControl. ###, p < 0.001 versus shRIM1&2. †, p < 0.05; †††, p < 0.001 versus shRIM3&4. Error bars, S.E.

Similar articles

Cited by

References

    1. Sheng M., Hoogenraad C. C. (2007) Annu. Rev. Biochem. 76, 823–847 - PubMed
    1. Ohtsuka T., Takao-Rikitsu E., Inoue E., Inoue M., Takeuchi M., Matsubara K., Deguchi-Tawarada M., Satoh K., Morimoto K., Nakanishi H., Takai Y. (2002) J. Cell Biol. 158, 577–590 - PMC - PubMed
    1. Zhai R. G., Bellen H. J. (2004) Physiology 19, 262–270 - PubMed
    1. Sudhof T. C. (2004) Annu. Rev. Neurosci. 27, 509–547 - PubMed
    1. Schoch S., Gundelfinger E. D. (2006) Cell Tissue Res. 326, 379–391 - PubMed

Publication types

Substances