. 2010 Jul 9;285(28):21446-57.
doi: 10.1074/jbc.M109.090043. Epub 2010 May 7.

Expression of a Src family kinase in chronic myelogenous leukemia cells induces resistance to imatinib in a kinase-dependent manner

Affiliations

Expression of a Src family kinase in chronic myelogenous leukemia cells induces resistance to imatinib in a kinase-dependent manner

Teodora Pene-Dumitrescu et al. J Biol Chem. .

Abstract

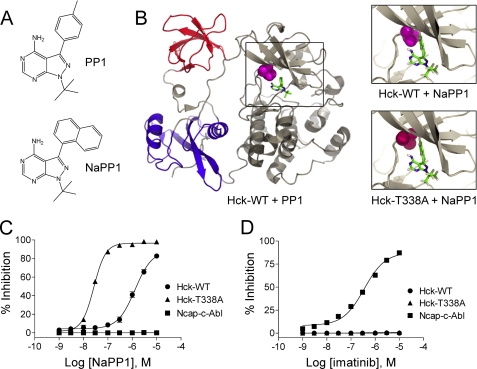
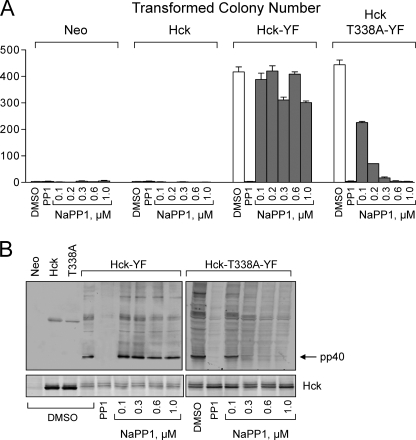
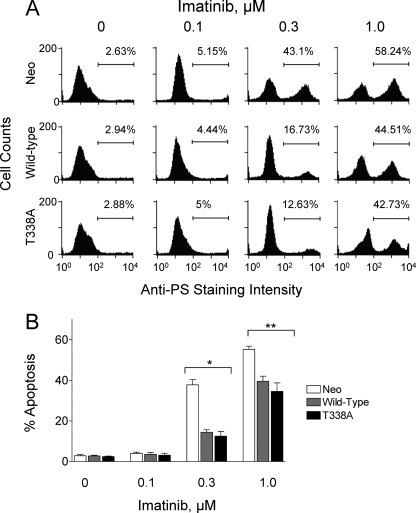
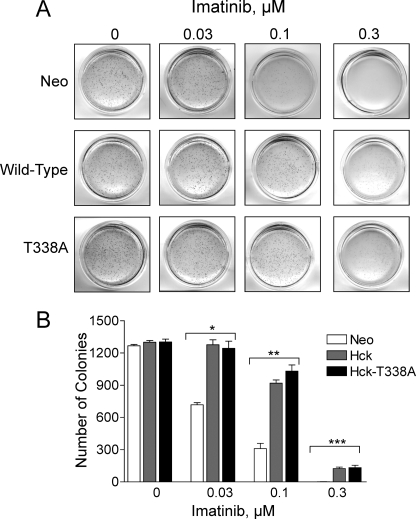
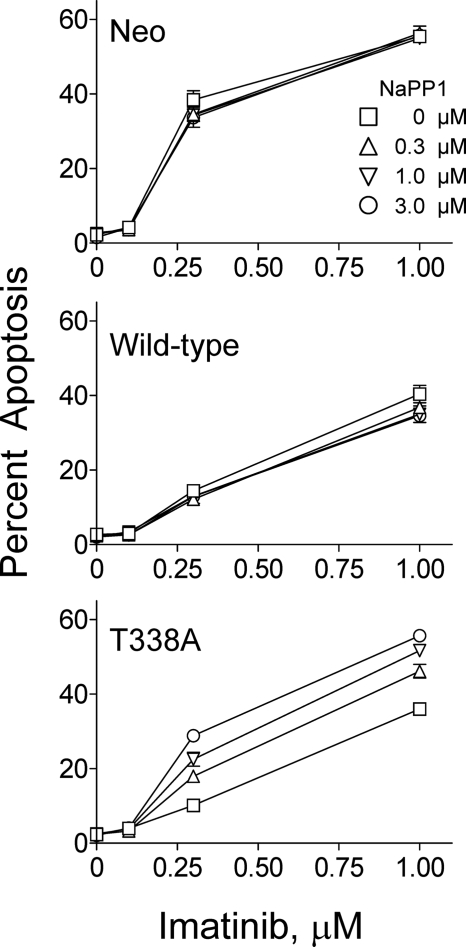
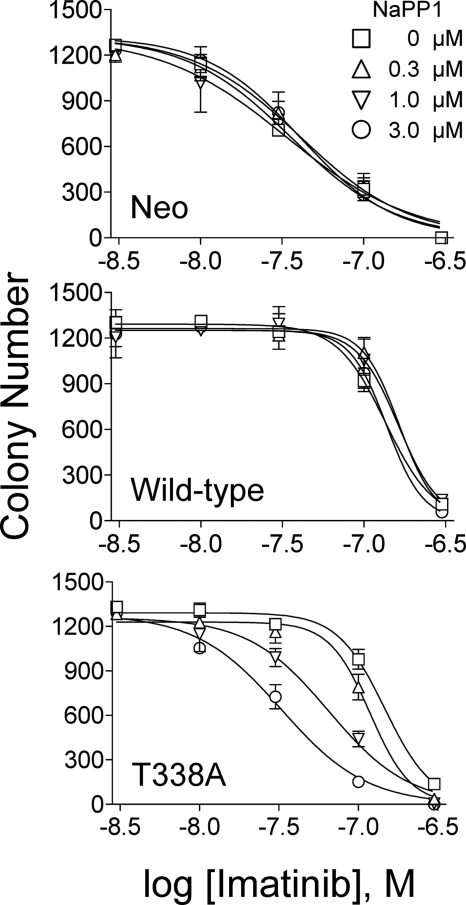
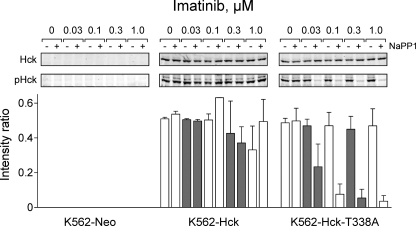
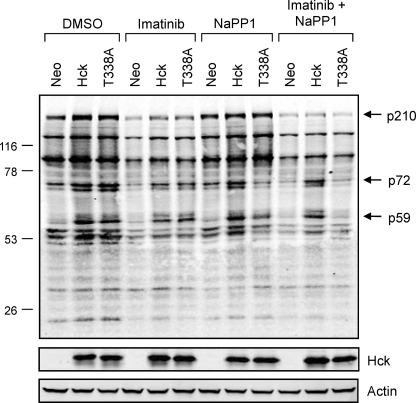
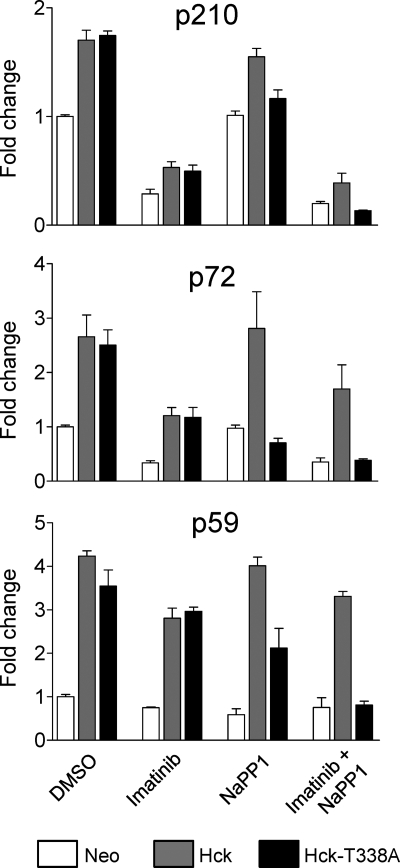
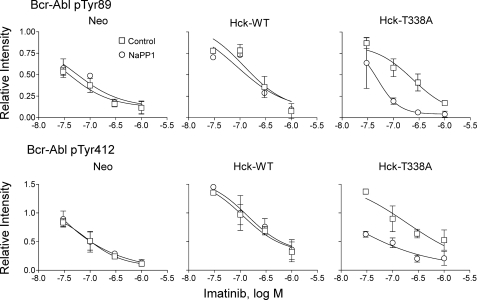
The Bcr-Abl kinase inhibitor imatinib is remarkably effective in chronic myelogenous leukemia (CML), although drug resistance is an emerging problem. Myeloid Src family kinases such as Hck and Lyn are often overexpressed in imatinib-resistant CML cells that lack Bcr-Abl mutations. Here we tested whether Hck overexpression is sufficient to induce imatinib resistance using both wild-type Hck and a mutant (Hck-T338A) that is uniquely sensitive to the pyrazolo-pyrimidine inhibitor, NaPP1. Expression of either kinase in K562 CML cells caused resistance to imatinib-induced apoptosis and inhibition of soft-agar colony formation. Treatment with NaPP1 restored sensitivity to imatinib in cells expressing T338A but not wild-type Hck, demonstrating that resistance requires Hck kinase activity. NaPP1 also reduced Hck-mediated phosphorylation of Bcr-Abl at sites that may affect imatinib sensitivity exclusively in cells expressing Hck-T338A. These data show that elevated Src family kinase activity is sufficient to induce imatinib resistance through a mechanism that may involve phosphorylation of Bcr-Abl.


Figures

FIGURE 1.
FIGURE 1.
Generation of NaPP1-sensitive Hck. A, structures of the non-selective SFK inhibitor PP1 and the bulky inactive analog, NaPP1 are shown. B, modeling of NaPP1 in the active site of wild-type Hck and the gatekeeper mutant, T338A is shown. The overall structure of Hck is shown on the left, with the SH3 domain in red, SH2 domain in blue, and the kinase domain in gray. The side chain of the gatekeeper residue (Thr-338) is highlighted in magenta, and its relationship to PP1 is shown in the boxed area. The model is based on the crystallographic coordinates of Schindler et al. (30) (PDB code 1QCF). Upper right, the spatial coordinates of the PP1 pyrazolo-pyrimidine were used to model the position of NaPP1 within the ATP binding site. This close-up view shows the clash of the naphthyl ring of NaPP1 with the side chain of the gatekeeper threonine. WT, wild type. Lower right, the T338A mutation was modeled in the Hck structure with the alanine side chain highlighted in red. This substitution creates a space that accommodates the naphthyl moiety of NaPP1 and sensitizes the kinase to this modified inhibitor. C and D, the Hck-T338A mutant is sensitive to NaPP1 but not to imatinib in an in vitro kinase assay. Recombinant wild-type Hck-YEEI (WT), Hck-T338A-YEEI, and Ncap-c-Abl were purified from Sf9 insect cells, and kinase activity was assessed in vitro using a fluorescence resonance energy transfer-based assay with a peptide substrate. Concentration-response curves are shown in the presence of NaPP1 (C) or imatinib (D). Percent inhibition is expressed as the mean ± S.D. from the results of four assay wells per condition. The entire experiment was repeated twice and produced comparable results; a representative example is shown.
FIGURE 2.
FIGURE 2.
Hck-T338A is biologically active in fibroblasts and selectively sensitive to NaPP1. Rat-2 fibroblasts were infected with recombinant retroviruses carrying a neomycin selection marker (Neo control), wild-type Hck, Hck-T338A, Hck-YF, or Hck-T338A-YF and selected with G418. A, cell populations were plated in triplicate in soft agar in the presence of the indicated concentrations of NaPP1. The general SFK inhibitor and parent compound PP1 (3 μm) was used as a positive control. Transformed colonies were stained with 3-(4,5-dimethyl-thiazol-2-yl)-2,5-diphenyltetrazolium bromide after 10–14 days and enumerated from scanned images using QuantityOne colony-counting software (Bio-Rad). Results from a representative experiment are shown as the mean number of colonies of three plates ±S.D. The statistical significance of Hck expression on colony formation was determined using one-way ANOVA (p < 0.0001) followed by Bonferroni's post test for multiple comparisons (p < 0.001 for Neo versus Hck-YF, Neo versus Hck-T338A-YF, Hck versus Hck-YF, and Hck versus Hck-T338A-YF; p > 0.05 for Neo versus Hck and Hck-YF versus Hck-T338A-YF). The effect of NaPP1 on colony formation by Hck-YF and Hck-T338A-YF cells was assessed using a two-tailed unpaired Student's t test (normal distribution and unequal variance; p < 0.02). The complete experiment was repeated twice with comparable results. B, control or Rat-2 fibroblasts transformed by Hck-YF or Hck-T338A-YF were plated overnight with the indicated concentrations of NaPP1, PP1 (3 μm), or with the vehicle alone (DMSO). Lysates were probed with an anti-phosphotyrosine antibody to determine the phosphorylation status of the endogenous Hck substrate, pp40. Hck expression was confirmed in replicate immunoblots. The entire experiment was repeated twice with comparable results. A representative example is shown.
FIGURE 3.
FIGURE 3.
Expression of wild-type Hck or Hck-T338A protects K562 cells from imatinib-induced apoptosis. K562-Neo, K562-Hck, and K562-Hck-T338A cell populations were incubated for 72 h in the absence or presence of the indicated concentrations of imatinib. Apoptotic cells were stained with an anti-phosphatidylserine-Alexa Fluor 488-conjugated antibody and the percentage of apoptotic cells was determined by flow cytometry. A, shown are histograms from a representative flow cytometry experiment with the percentage of apoptotic cells shown above each plot. PS, phosphatidylserine. B, bar graph showing the average percentage of apoptotic cells from three independent experiments ±S.D. Two-way ANOVA showed significant effects of Hck or Hck-T338A expression (p < 0.0001) and of imatinib treatment (p < 0.0001). One-way ANOVA was performed separately for each concentration of imatinib across the three groups. The percent apoptosis among the three cell lines was statistically significant at 0.3 μm imatinib and 1 μm imatinib (*, p = 0.0003 and **, p = 0.006). Bonferroni's post test for multiple comparisons showed a p < 0.001 for Neo versus Hck and Neo versus Hck-T338A at 0.3 μm imatinib and a p < 0.05 for Neo versus Hck and Neo versus Hck-T338A at 1 μm imatinib.
FIGURE 4.
FIGURE 4.
Expression of wild-type Hck or Hck-T338A protects K562 cells from imatinib-induced inhibition of soft-agar colony formation. K562-Neo, K562-Hck, and K562-Hck-T338A cell populations were plated in soft agar colony assays in the presence of the concentrations of imatinib shown. A, colonies were stained 7–10 days later, and representative images of the plates are shown. B, the bar graph shows the average number of colonies from three independent experiments ±S.D. Two-way ANOVA showed significant effects of Hck or Hck-T338A expression (p < 0.0001) and of imatinib treatment (p < 0.0001). One-way ANOVA was performed separately for each concentration of imatinib, across the three groups. The effect of imatinib on colony formation by the three cell lines was statistically significant at 0.03, 0.1, and 0.3 μm (*, p = 0.0003; **, p < 0.0001; ***, p = 0.0015, respectively). Bonferroni's post test for multiple comparisons showed p < 0.001 for Neo versus Hck and Neo versus Hck-T338A at 0.03 and 0.1 μm imatinib and p < 0.01 for Neo versus Hck and Neo versus Hck-T338A at 0.3 μm imatinib.
FIGURE 5.
FIGURE 5.
Inhibition of Hck-T338A kinase activity with NaPP1 selectively restores the apoptotic response to imatinib in K562-Hck-T338A cells. K562-Neo, K562-Hck, and K562-Hck-T338A cell populations were incubated with the indicated combinations of imatinib and NaPP1 for 72 h. Apoptotic cells were stained with an anti-phosphatidylserine antibody conjugated to Alexa Fluor 488, and the percentage of apoptotic cells was determined by flow cytometry. The apoptotic response to imatinib was plotted for each individual NaPP1 concentration. Each point represents the average percentage of apoptotic cells generated from three independent experiments ±S.D. Two-way ANOVA was performed to determine statistical significance of the effect of imatinib and NaPP1 on each individual cell line. For K562-Neo and K562-Hck cells, the apoptotic effect of imatinib was statistically significant with p < 0.0001, whereas NaPP1 had no significant effect (p > 0.05). For K562-Hck-T338A cells, both imatinib and NaPP1 had a significant effect (p < 0.0001).
FIGURE 6.
FIGURE 6.
Inhibition of Hck-T338A kinase activity with NaPP1 selectively restores the sensitivity of K562-Hck-T338A cells to imatinib in the colony-forming assay. K562-Neo, K562-Hck, and K562-Hck-T338A cell populations were plated in colony-forming assays in the presence of the indicated combinations of imatinib and NaPP1. Colonies were stained 10–14 days later and were counted from scanned images of the plates. Each data point represents the average colony count from three replicate plates ±S.D. The entire experiment was repeated twice from independently derived cell populations and yielded comparable results. A representative experiment is shown. Two-way ANOVA was performed to determine statistical significance of the effect of imatinib and NaPP1 on each cell line. For K562-Neo and K562-Hck cells, the effect of imatinib on colony formation was statistically significant with p < 0.0001, whereas NaPP1 had no significant effect (p > 0.05). For K562-Hck-T338A cells, both imatinib and NaPP1 had a significant effect (p < 0.0001).
FIGURE 7.
FIGURE 7.
NaPP1 selectively inhibits Hck-T338A in K562 cells. K562-Neo, K562-Hck, and K562-Hck-T338A cell populations were grown in 0.5% FBS overnight and treated with the indicated concentrations of imatinib and NaPP1 (3 μm) for 5 h. Hck was immunoprecipitated from clarified cell lysates and immunoblotted with a phosphospecific antibody that recognizes the tyrosine-phosphorylated activation loop of Hck (pHck). Duplicate membranes were blotted for Hck as a loading control. Western blots were analyzed using the Odyssey Infrared Imaging System. The Hck phosphotyrosine signal intensities were normalized to the levels of Hck protein from the blots of two independent experiments, and the average intensity ratios ±S.D. are presented in the bar graph. The entire experiment was repeated twice from independently derived cell populations with comparable results; representative blots are shown at the top. Two-way ANOVA was performed to determine statistical significance of the effect of imatinib and NaPP1 on the phosphorylation of Hck within each cell line. For K562-Hck, neither imatinib nor NaPP1 had a significant effect (p > 0.3), whereas for K562-Hck-T338A, NaPP1 treatment produced a significant reduction in Hck phosphorylation (p < 0.0001).
FIGURE 8.
FIGURE 8.
Wild-type Hck or Hck-T338A overexpression enhances tyrosine phosphorylation of several proteins in K562 cells without changing the overall tyrosine phosphoprotein banding pattern. K562 cells were infected with recombinant retroviruses carrying a neomycin selection marker (Neo), wild-type Hck or Hck-T338A and selected with G418. The resulting cell populations were plated in 0.5% FBS overnight and treated with the DMSO carrier solvent, imatinib (1 μm), NaPP1 (3 μm), or imatinib plus NaPP1 for 5 h. Cell lysates were resolved by SDS-PAGE, transferred to nitrocellulose membranes, and probed with anti-phosphotyrosine (top) and anti-Hck antibodies. Immunoreactive proteins were simultaneously detected using the Odyssey Infrared Imaging System (LI-COR). As a loading control, replicate blots were also probed with an anti-actin antibody. Using the Odyssey 3.0 software, the position of each molecular weight marker was used to estimate the molecular weights of each tyrosine phosphoprotein. The positions of the three bands showing the most prominent changes in phosphotyrosine content after Hck expression are indicated (p210, p72, and p59). This entire experiment was repeated three times from independently derived cell populations and produced comparable results in each case.
FIGURE 9.
FIGURE 9.
Phosphorylation of p210 and p72 is Hck-dependent in K562 cells. Signal intensities for the three major NaPP1-sensitive tyrosine phosphoproteins shown in Fig. 8 (p210, p72, and p59) were quantitated from anti-phosphotyrosine immunoblots of three independent K562-Neo, K562-Hck, and K562-Hck-T338M cell populations after treatment with imatinib, NaPP1, or both as described in the legend to Fig. 8. The bar graphs show the -fold changes relative to DMSO-treated K562-Neo control cells of the average phosphotyrosine signal intensities ±S.D. for p210 (Bcr-Abl), p72, and p59 (Hck).
FIGURE 10.
FIGURE 10.
Wild-type Hck or Hck-T338A overexpression increases Bcr-Abl phosphorylation at regulatory tyrosines 89 and 412 in a Hck kinase-dependent manner. K562-Neo, K562-Hck (wild-type (WT)), and K562-Hck-T338A cell populations were plated in 0.5% FBS overnight and treated with the concentrations of imatinib indicated and in the presence or absence of 3 μm NaPP1 for 5 h. Cell lysates were resolved by SDS-PAGE, transferred to nitrocellulose, and immunoblotted with phosphospecific antibodies for Abl pY89 or pY412. Immunoblots were analyzed using the Odyssey Infrared Imaging System. Site-specific phosphotyrosine signal intensities from two independent experiments were normalized to the corresponding levels of Bcr-Abl protein as determined by anti-Abl immunoblotting. The normalized phosphotyrosine band intensities are plotted relative to the ratios obtained from DMSO-treated K562-Neo control cell populations ±S.D. The data points were fitted by nonlinear regression analysis using GraphPad Prizm. Note that Hck expression shifts the imatinib concentration-response curves for both phosphorylation sites upward and to the right, indicative of enhanced phosphorylation and reduced drug sensitivity. These shifts are completely and exclusively reversed in Hck-T338A cells after treatment with NaPP1. Images of the immunoblots used to generate these curves, as well as additional data for Bcr-Abl Tyr-245 and Tyr-177 are shown in supplemental Fig. S3.

Similar articles

Cited by

References

    1. Deininger M. W., Goldman J. M., Melo J. V. (2000) Blood 96, 3343–3356 - PubMed
    1. Groffen J., Stephenson J. R., Heisterkamp N., de Klein A., Bartram C. R., Grosveld G. (1984) Cell 36, 93–99 - PubMed
    1. Shtivelman E., Lifshitz B., Gale R. P., Canaani E. (1985) Nature 315, 550–554 - PubMed
    1. Raitano A. B., Whang Y. E., Sawyers C. L. (1997) Biochim. Biophys. Acta 1333, F201–F216 - PubMed
    1. Hantschel O., Superti-Furga G. (2004) Nat. Rev. Mol. Cell Biol. 5, 33–44 - PubMed

Publication types

MeSH terms