Comparative Study
. 2010 Jun 2;102(11):771-83.
doi: 10.1093/jnci/djq107. Epub 2010 May 7.

Risk of colon cancer and coffee, tea, and sugar-sweetened soft drink intake: pooled analysis of prospective cohort studies

Affiliations
Comparative Study

Risk of colon cancer and coffee, tea, and sugar-sweetened soft drink intake: pooled analysis of prospective cohort studies

Xuehong Zhang et al. J Natl Cancer Inst. .

Abstract

Background: The relationships between coffee, tea, and sugar-sweetened carbonated soft drink consumption and colon cancer risk remain unresolved.

Methods: We investigated prospectively the association between coffee, tea, and sugar-sweetened carbonated soft drink consumption and colon cancer risk in a pooled analysis of primary data from 13 cohort studies. Among 731 441 participants followed for up to 6-20 years, 5604 incident colon cancer case patients were identified. Study-specific relative risks (RRs) and 95% confidence intervals (CIs) were estimated using Cox proportional hazards models and then pooled using a random-effects model. All statistical tests were two-sided.

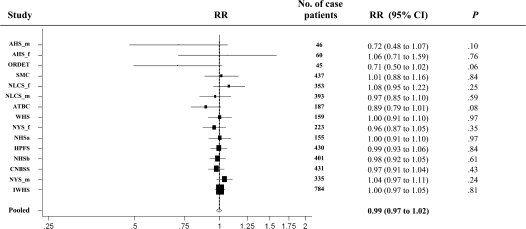
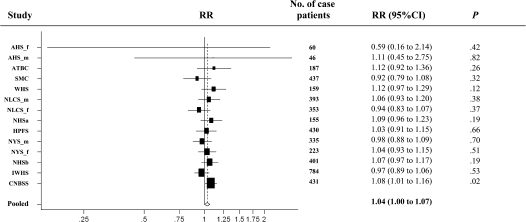
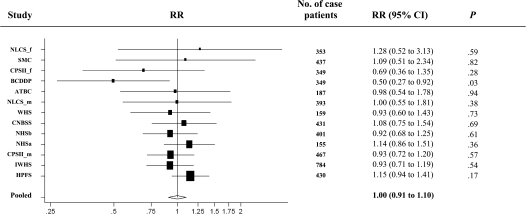
Results: Compared with nonconsumers, the pooled multivariable relative risks were 1.07 (95% CI = 0.89 to 1.30, P(trend) = .68) for coffee consumption greater than 1400 g/d (about six 8-oz cups) and 1.28 (95% CI = 1.02 to 1.61, P(trend) = .01) for tea consumption greater than 900 g/d (about four 8-oz cups). For sugar-sweetened carbonated soft drink consumption, the pooled multivariable relative risk comparing consumption greater than 550 g/d (about 18 oz) to nonconsumers was 0.94 (95% CI = 0.66 to 1.32, P(trend) = .91). No statistically significant between-studies heterogeneity was observed for the highest category of each beverage consumed (P > .20). The observed associations did not differ by sex, smoking status, alcohol consumption, body mass index, physical activity, or tumor site (P > .05).

Conclusions: Drinking coffee or sugar-sweetened carbonated soft drinks was not associated with colon cancer risk. However, a modest positive association with higher tea consumption is possible and requires further study.


Figures

Figure 1
Figure 1
Forest plot of coffee drinking (increment, 250 g/d; 8-oz cup is about 237 g) and relative risk (RR) of colon cancer. The black squares and the horizontal lines represent the study-specific relative risk and corresponding 95% confidence intervals (CIs), respectively. The area of the black square reflects the weight of each study, measured by the inverse of the variance. The diamond represents the pooled multivariable relative risk with 95% confidence interval. The vertical dashed line provides a visual comparison of the pooled relative risk with the study-specific relative risk. AHS_f = Adventist Health Study (women); AHS_m = Adventist Health Study (men); ATBC = Alpha-Tocopherol Beta-Carotene Cancer Prevention Study (men); CNBSS = Canadian National Breast Screening Study (women); HPFS = Health Professionals Follow-up Study (men); IWHS = Iowa Women's Health Study (women); NHSa = Nurses’ Health Study (a) (women); NHSb = Nurses’ Health Study (b) (women); NLCS_f = Netherlands Cohort Study (women); NLCS_m = Netherlands Cohort Study (men); NYS_f = New York State Cohort (women); NYS_m = New York State Cohort (men); ORDET = Prospective Study on Hormones, Diet and Breast Cancer (women); SMC = Swedish Mammography Cohort (women); WHS = Women's Health Study (women).
Figure 2
Figure 2
Forest plot of tea drinking (increment, 250 g/d; 8-oz cup is about 237 g) and relative risk (RR) of colon cancer. The black squares and the horizontal lines represent the study-specific relative risk and the corresponding 95% confidence intervals (CIs), respectively. The area of the black square reflects the weight of each study, measured by the inverse of the variance. The diamond represents the pooled multivariable relative risk with 95% confidence interval. The vertical dashed line provides a visual comparison of the pooled relative risk with the study-specific relative risk. AHS_f = Adventist Health Study (women); AHS_m = Adventist Health Study (men); ATBC = Alpha-Tocopherol Beta-Carotene Cancer Prevention Study (men); CNBSS = Canadian National Breast Screening Study (women); HPFS = Health Professionals Follow-up Study (men); IWHS = Iowa Women's Health Study (women); NHSa = Nurses’ Health Study (a) (women); NHSb = Nurses’ Health Study (b) (women); NLCS_f = Netherlands Cohort Study (women); NLCS_m = Netherlands Cohort Study (men); NYS_f = New York State Cohort (women); NYS_m = New York State Cohort (men); SMC = Swedish Mammography Cohort (women); WHS = Women's Health Study (women).
Figure 3
Figure 3
Forest plot of sugar-sweetened carbonated soft drink consumption (increment, 375 g/d; 12-oz cup is about 355 g) and relative risk (RR) of colon cancer. The black squares and the horizontal lines represent the study-specific relative risk and the corresponding 95% confidence intervals (CIs), respectively. The area of the black square reflects the weight of each study, measured by the inverse of the variance. The diamond represents the pooled multivariable relative risk with 95% confidence interval. The vertical dashed line provides a visual comparison of the pooled relative risk with the study-specific relative risk. ATBC = Alpha-Tocopherol Beta-Carotene Cancer Prevention Study (men); BCDDP = Breast Cancer Detection Demonstration Project Follow-up Study; CNBSS = Canadian National Breast Screening Study (women); CPSII_f = Cancer Prevention Study II Nutrition Cohort (women); CPSII_m = Cancer Prevention Study II Nutrition Cohort (men); HPFS = Health Professionals Follow-up Study (men); IWHS = Iowa Women's Health Study (women); NHSa = Nurses’ Health Study (a) (women); NHSb = Nurses’ Health Study (b) (women); NLCS_f = Netherlands Cohort Study (women); NLCS_m = Netherlands Cohort Study (men); SMC = Swedish Mammography Cohort (women); WHS = Women's Health Study (women).

Comment in

Similar articles

Cited by

References

    1. Ferlay J, Bray F, Pisani P, Parkin D. GLOBOCAN 2002: Cancer Incidence, Mortality and Prevalence Worldwide. IARC CancerBase No. 5 version 2.0. Lyon, France: IARC Press; 2004.
    1. Word Cancer Research Fund. Food, Nutrition and the Prevention of Cancer: A Global Perspective. Washington, DC: American Institute for Cancer Research; 2007. American Institute for Cancer Research Expert Panel. - PubMed
    1. Wei EK, Giovannucci E, Wu K, et al. Comparison of risk factors for colon and rectal cancer. Int J Cancer. 2004;108(3):433–442. - PMC - PubMed
    1. Potter JD. Nutrition and colorectal cancer. Cancer Causes Control. 1996;7(1):127–146. - PubMed
    1. Higdon JV, Frei B. Tea catechins and polyphenols: health effects, metabolism, and antioxidant functions. Crit Rev Food Sci Nutr. 2003;43(1):89–143. - PubMed

Publication types

MeSH terms