. 2010 Oct;20(10):2265-76.
doi: 10.1093/cercor/bhq068. Epub 2010 May 7.

Dimensions of a projection column and architecture of VPM and POm axons in rat vibrissal cortex

Affiliations

Dimensions of a projection column and architecture of VPM and POm axons in rat vibrissal cortex

Verena C Wimmer et al. Cereb Cortex. 2010 Oct.

Abstract

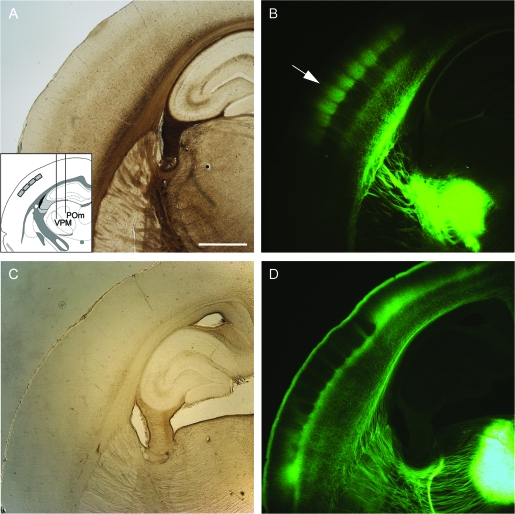
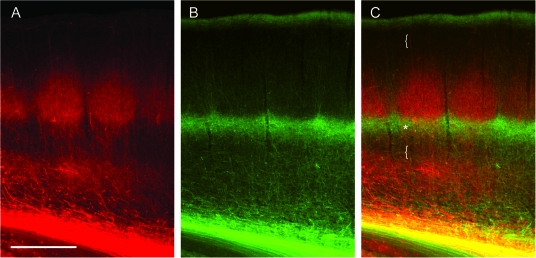
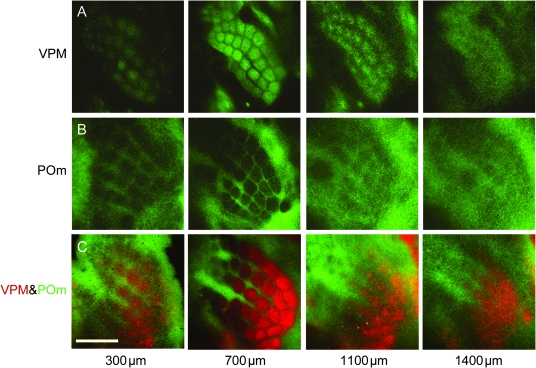
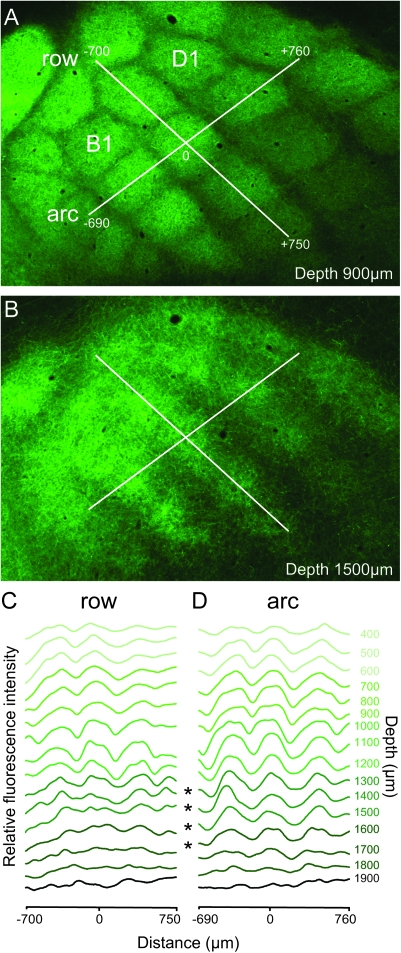
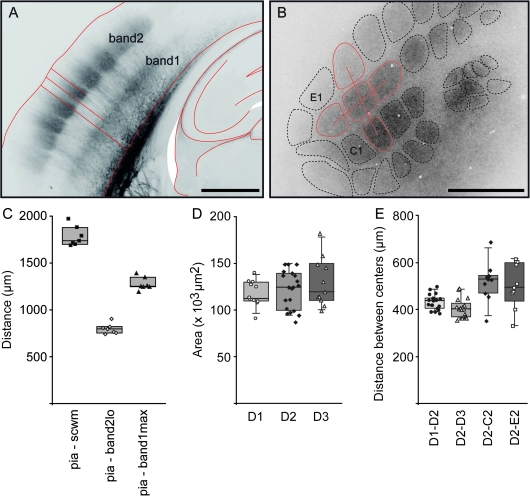
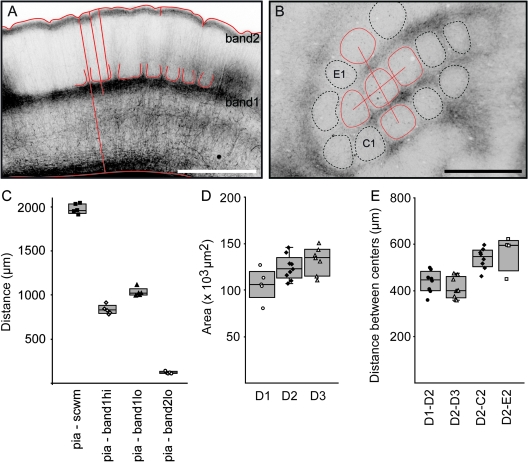
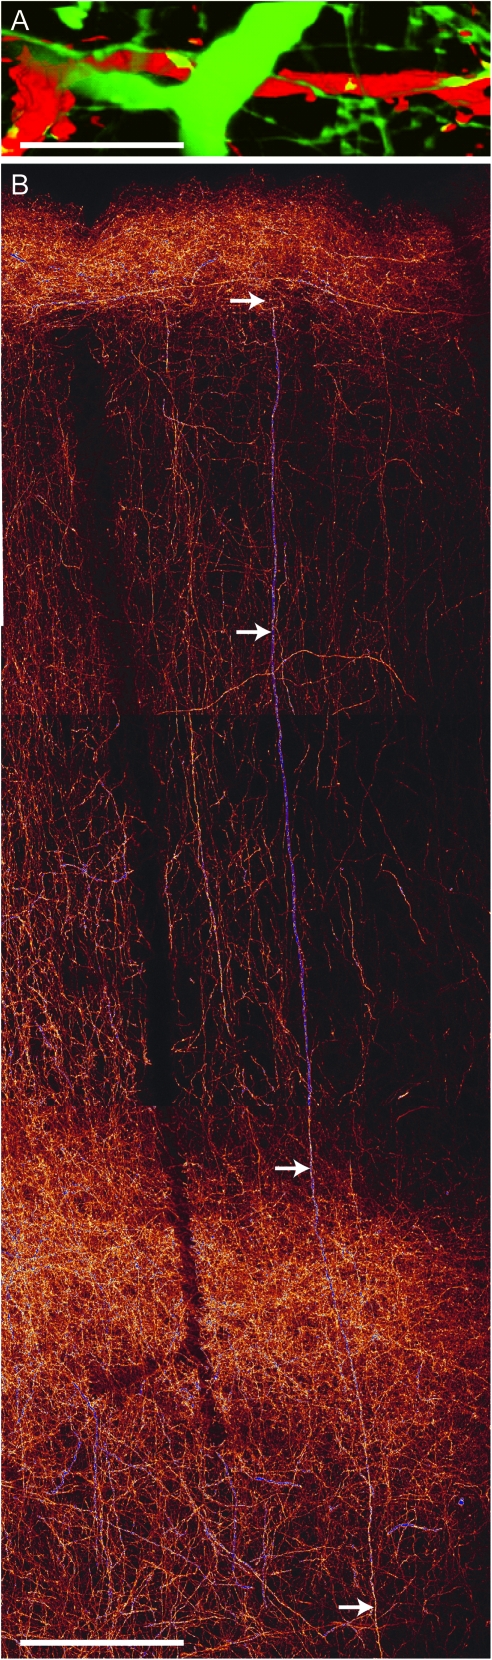
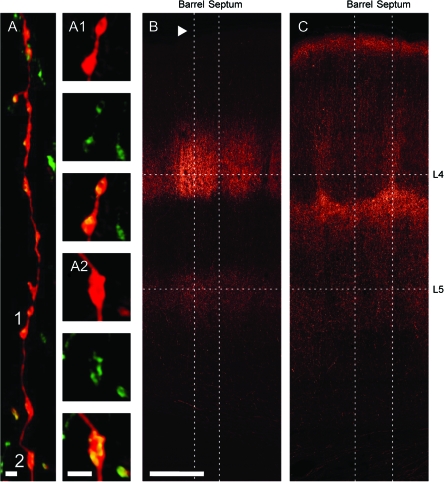
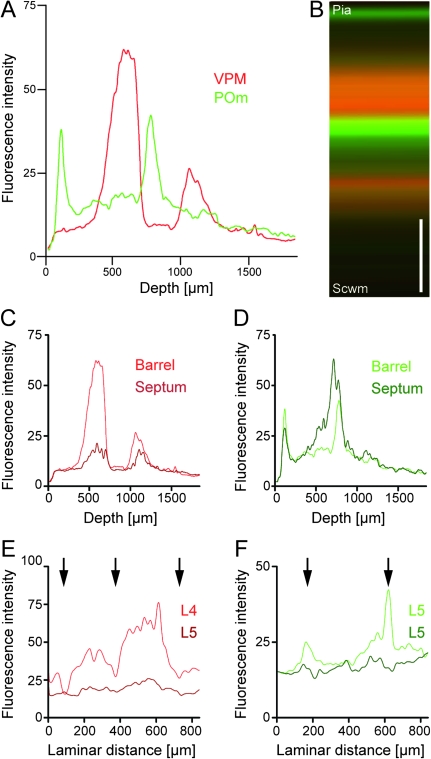
This is the first article in a series of 3 studies that investigate the anatomical determinants of thalamocortical (TC) input to excitatory neurons in a cortical column of rat primary somatosensory cortex (S1). S1 receives 2 major types of TC inputs, lemiscal and paralemniscal. Lemiscal axons arise from the ventral posteromedial nucleus (VPM) of the thalamus, whereas paralemniscal fibers originate in the posteromedial nucleus (POm). While these 2 TC projections are largely complementary in L4, overlap in other cortical layers is still a matter of debate. VPM and POm axons were specifically labeled in the same rat by virus-mediated expression of different fluorescent proteins. We show that columnar and septal projection patterns are maintained throughout most of the cortical depth with a lower degree of separation in infragranular layers, where TC axons form bands along rows. Finally, we present anatomical dimensions of "TC projection domains" for a standard column in S1.


Figures

Figure 1.
Figure 1.
TC projections from VPM and POm to S1. (A) Brightfield image of a TC section that includes part of the barrel field. Inset: Schematic drawing of specific stereotaxic injection into VPM and POm, respectively. (B) Bulk labeling of VPM axons, epifluorescence image of the TC section shown in A. Arrow: drop-like structures defined by VPM projections. (C) Brightfield image of TC section from a different animal with AAV injection into POm. (D) Bulk labeling of POm axons, same section as shown in C. Scale bar 1 mm.
Figure 2.
Figure 2.
Dual labeling of VPM and POm axons. Labeling of VPM and POm axons in the same animal by AAV-mediated expression of different fluorescent proteins. (A) VPM projections (mRFP; red) in a TC slice. (B) POm projections (EGFP; green). (C) Merge of A and B, illustrating afferent sparse zones of low fluorescence (braces). Potential overlap of VPM and POm axon fluorescence in the deeper portion of barrels (yellow, asterisk). Scale bar 500 μm.
Figure 3.
Figure 3.
VPM and POm projections span most of the cortex width and complement each other. Tangential sections at different depths as indicated. (A) VPM axons. (B) POm axons. (C) Two-color labeling of VPM and POm axons in the same animal by expression of 2 different fluorescent proteins illustrates complementary projection patterns (VPM: red; POm: green; Koralek et al. 1988).
Figure 4.
Figure 4.
VPM projections form rows in infragranular cortical layers. (A) Fluorescence image of tangential section at ∼900 μm depth. Lines indicate regions of interest (ROIs) along C-row (shown in aligned serial sections in C) and arc 2 (shown in D). (B) Tangential section at ∼1500 μm depth with ROIs projected down from L4. (C) Fluorescence intensity profiles along C-row throughout the depth of the cortex measured in serial tangential sections aligned using radial blood vessels. (D) Analogous to C but along arc 2. Asterisks indicate that in infragranular layers fluorescence profiles show peaks and valleys along arcs but not along rows.
Figure 5.
Figure 5.
Landmarks and dimensions of VPM projections. (A) Fluorescence image of VPM projection pattern in a TC section. Anatomical landmarks of VPM projections in cortex are pia and SCWM, indicated as red outlines. The VPM projections form 2 tangential bands referred to as VPM band1 (closer to the SCWM) and VPM band2 (closer to the pia). Distances analyzed for C are indicated as red lines: pia–SCWM, pia-band2lo (i.e., lower edge of band2), pia-band1max (i.e., the maximum of band1). Another band close to the SCWM was not quantified as it does not appear with bouton-specific labeling. Scale bar 1 mm. (B) Fluorescence image of VPM projection pattern in a tangential section at 800 μm depth. Here, anatomical landmarks are the cross-sectional area of VPM axon arbor outline and the distances between “centers of mass” of barrel border outlines as indicated by red lines. Scale bar 1 mm. (C) Distances between landmarks for columns in arc 2 and 3 as measured in 7 TC sections. Mean distances: pia–SCWM 1782 μm (range 1688–1970 μm), pia-band2lo 798 μm (range 740–901 μm) and pia-band2max 1277 μm (range 1194–1390 μm). (D) Cross-sectional area of the D1, D2, and D3 projection column (ANOVA, P = 0.35). (E) Center-to-center distances between VPM projection to the D2 column and 4 of its surround columns as indicated. Measurements were made using sections at 700–900 μm depth from pia.
Figure 6.
Figure 6.
Landmarks and dimensions of POm projections. (A) Fluorescence image of POm projection pattern in a TC section. The POm projections form 2 POm innervation bands, POm band1 (closer to the SCWM), and POm band2 (underneath pia). Distances measured for C are indicated as red lines: pia–SCWM, pia-band1hi, pia-band1lo, and pia-band2lo. Scale bar 1 mm. (B) Fluorescence image of POm projection pattern in a tangential section at 900 μm depth. Anatomical landmarks used were the outlines of hollows to determine the cross-sectional area and the mean distances between the centers of hollows as indicated by red lines. Scale bar 1 mm. (C) Distances between landmarks of POm projections (n = 5). Mean distances: pia–SCWM 1977 μm (range 1908–2042 μm), pia-band1hi 834 μm (range 780–914 μm), pia-band1lo 1031 μm (range 996–1116 μm), and pia - band2 116 μm (range 106–140). (D) Cross-sectional area of the D1, D2, and D3 hollows (ANOVA, P = 0.02; Tukey, P < 0.05). (E) Center-to-center distance between 4 of the hollows surrounding D2.
Figure 7.
Figure 7.
Large caliber axons: highway to the cortex? (A) High-magnification image of a large caliber axon branch segment in L1. Green: giant POm axon; red: apical dendrite of an infragranular pyramidal cell labeled with biocytin–streptavidin–Alexa594. Scale bar 10 μm. (B) Reconstruction of a large caliber axon extending from SCWM to L1 (arrows). The image represents a montage of maximum projections of confocal stacks. Scale bar 100 μm.
Figure 8.
Figure 8.
Bouton distributions of VPM and POm define borders of columns and septa. (A) VPM axon with synaptophysin-EGFP–labeled presynaptic boutons and biocytin-volume fill (streptavidin–Alexa594 detection). Vesicle clusters are exclusively associated with axonal varicosities. 3D reconstruction of a confocal stack. (A1, A2) Higher magnification images of the 2 single boutons indicated in A as 1 and 2, respectively. Top image in each panel illustrates the axonal volume fill, middle image shows the vesicle cluster, and the bottom image is an overlay of both. Scale bars 1 μm. (B) Maximum projection of a confocal stack showing bouton distribution after VPM injection of AAV-synaptophysin-EGFP. Dotted lines indicate scan lines for calculating bouton density profiles in the vertical (column and septum axes) and horizontal plane (L4 and L5), respectively (see Fig. 9). Arrow indicates pia. (C) As B but after POm injection of AAV-synaptophysin-EGFP. Scale bar 250 μm.
Figure 9.
Figure 9.
Bouton density profiles of VPM and POm projections reveal overlap domains. (A) Vertical column profiles of VPM (red line) and POm (green line) bouton fluorescence intensity (in relative units) measured in TC slices between pia and SCWM. Boutons were labeled as described in Figure 8. (B) Separation and overlap of VPM and POm projections in a column. Merged profiles of VPM (red) and POm bouton (green) projections illustrate well separated and partially overlapping projection domains (yellow) of VPM and POm boutons at different depths. Two afferent sparse zones are also apparent. Total length between pia and SCWM is normalized to “standard length” 1840 μm VPM bouton in red and POm bouton profile in green. Scale bar 0.5 mm. (C) VPM bouton profiles along vertical column axis (bright red) and septum (dark red). (D) POm bouton profiles along vertical column axis (bright green) and septum (dark green). (E) Horizontal profiles across column borders for VPM boutons at 2 different depths from the pia as indicated in Figure 8. Individual fluorescence peaks are clearly separated by darker septa at ∼750 μm depth (bright red; arrows). At 1200 μm depth, a weak laminar patterning is still present (dark red). (F) As E for POm boutons. At ∼750 μm depth septa are clearly delineated (bright green, arrows). No clear separation between columns and septa is visible at 1200 μm depth (dark green).

Comment in

References

    1. Agmon A, Connors BW. Thalamocortical responses of mouse somatosensory (barrel) cortex in vitro. Neuroscience. 1991;41:365–379. - PubMed
    1. Agmon A, Yang LT, O'Dowd DK, Jones EG. Organized growth of thalamocortical axons from the deep tier of terminations into layer IV of developing mouse barrel cortex. J Neurosci. 1993;13:5365–5382. - PMC - PubMed
    1. Ahissar E, Sosnik R, Bagdasarian K, Haidarliu S. Temporal frequency of whisker movement. II. Laminar organization of cortical representations. J Neurophysiol. 2001;86:354–367. - PubMed
    1. Alloway KD. Information processing streams in rodent barrel cortex: the differential functions of barrel and septal circuits. Cereb Cortex. 2008;18:979–989. - PubMed
    1. Alloway KD, Zhang M, Chakrabarti S. Septal columns in rodent barrel cortex: functional circuits for modulating whisking behavior. J Comp Neurol. 2004;480:299–309. - PubMed

Publication types

MeSH terms

Substances