

doi: 10.1038/ng.585.
Epub 2010 May 9.
Variation in CDKN2A at 9p21.3 influences childhood acute lymphoblastic leukemia risk
Affiliations
- PMID: 20453839
- PMCID: PMC3434228
- DOI: 10.1038/ng.585
Item in Clipboard
Variation in CDKN2A at 9p21.3 influences childhood acute lymphoblastic leukemia risk
Nat Genet.
2010 Jun.
Abstract
Using data from a genome-wide association study of 907 individuals with childhood acute lymphoblastic leukemia (cases) and 2,398 controls and with validation in samples totaling 2,386 cases and 2,419 controls, we have shown that common variation at 9p21.3 (rs3731217, intron 1 of CDKN2A) influences acute lymphoblastic leukemia risk (odds ratio = 0.71, P = 3.01 x 10(-11)), irrespective of cell lineage.
Conflict of interest statement
The authors declare no competing financial interests.
Figures
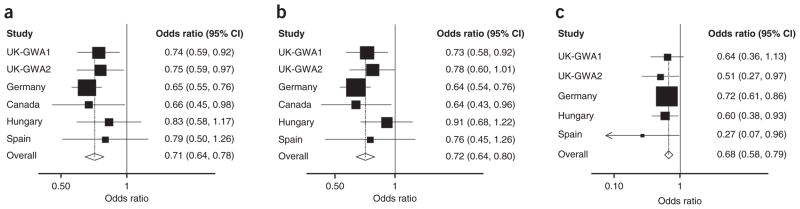
Forest plots of effect size and direction for 9p21.3 (rs3731217) association. (a–c) Association between all cases of ALL (a), BCP-ALL cases (b) and T-ALL cases and controls (c). Boxes denote OR point estimates, with their areas being proportional to the inverse variance weight of the estimate. Horizontal lines represent 95% CIs. The diamond and dashed line represent the summary OR computed under a fixed effects model, with the 95% CI indicated by the width of the diamond. The unbroken vertical line is at the null value (OR = 1.0).
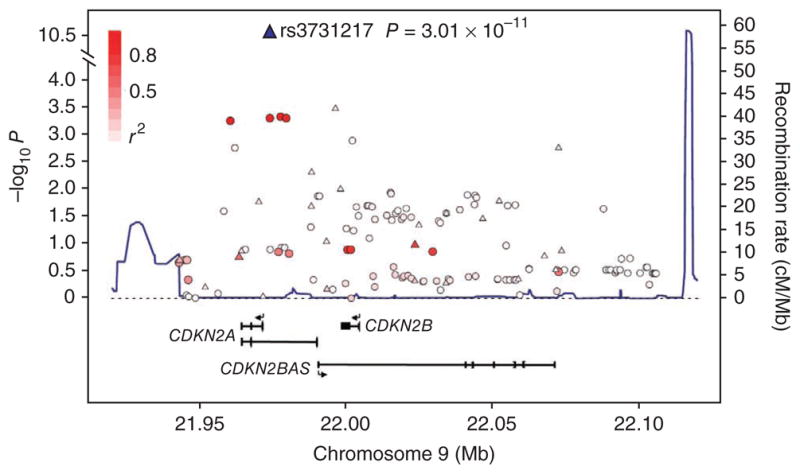
LD structure and association results for the 9p21.3 ALL locus. The local recombination rate is plotted in dark blue over this 174-kb chromosomal segment. Armitage trend test P values (as −log10
P values along the left y axis; note the broken axis between 4.0 and 10.5) are shown for the SNPs analyzed. Each triangle represents a SNP genotyped in the GWA study, circles represent imputed SNPs, and the most associated SNP in the combined analysis, rs3731217, is marked by a triangle (blue in combined analysis). The color intensity of each □ reflects the extent of LD with rs3731217, indicated by red (r2 > 0.8) going to white (r2 < 0.2). Physical positions are based on NCBI build 36 of the human genome. Also shown are the relative positions of genes mapping to each region of association. Exons of genes have been redrawn to show the relative positions in the gene, and therefore maps are not to physical scale.
References
Publication types
MeSH terms
Grants and funding
LinkOut - more resources
Full Text Sources
Miscellaneous
