. 2010 Jun;11(6):535-42.
doi: 10.1038/ni.1877. Epub 2010 May 9.

PD-1 regulates germinal center B cell survival and the formation and affinity of long-lived plasma cells

Affiliations

PD-1 regulates germinal center B cell survival and the formation and affinity of long-lived plasma cells

Kim L Good-Jacobson et al. Nat Immunol. 2010 Jun.

Abstract

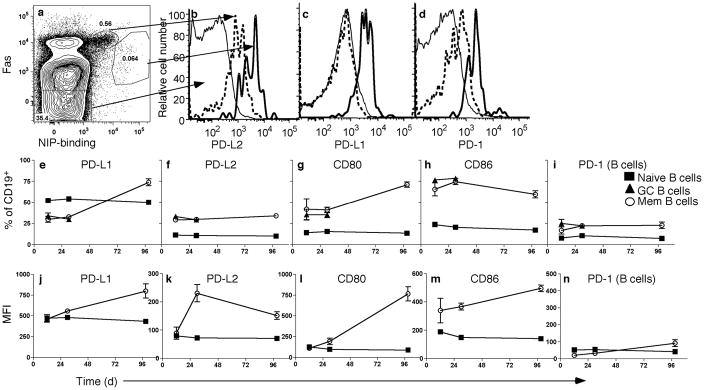
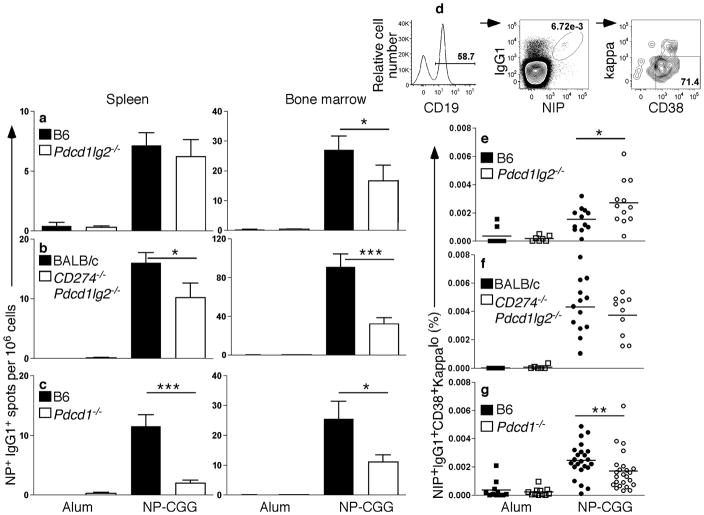
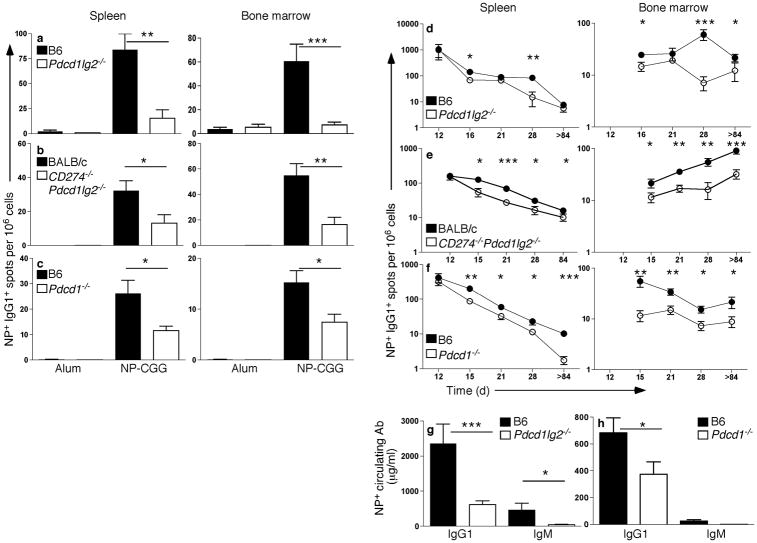
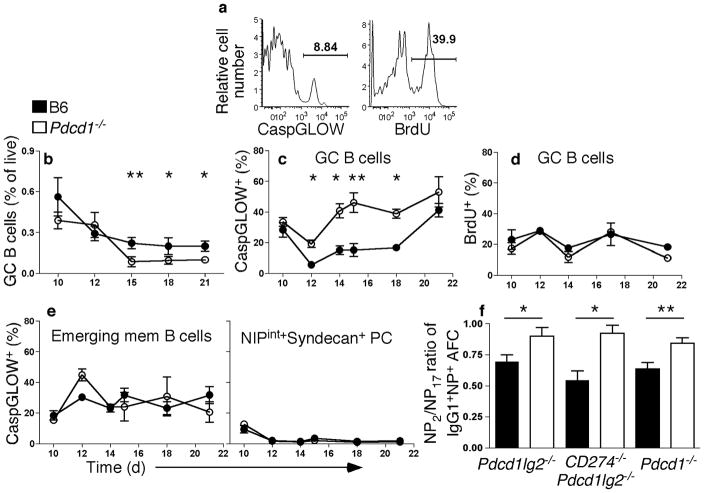
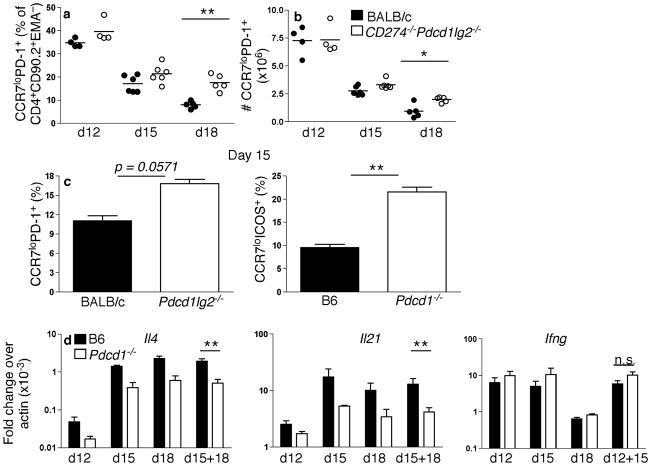
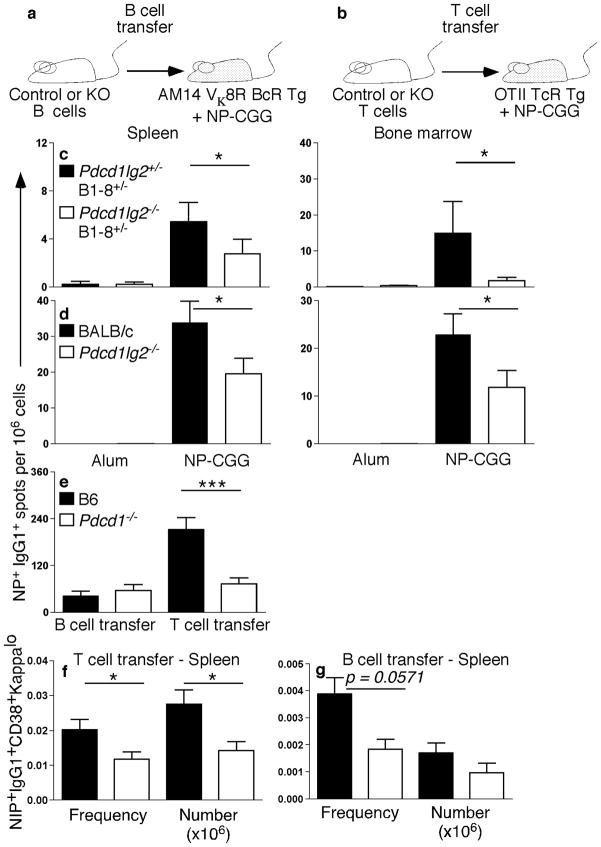
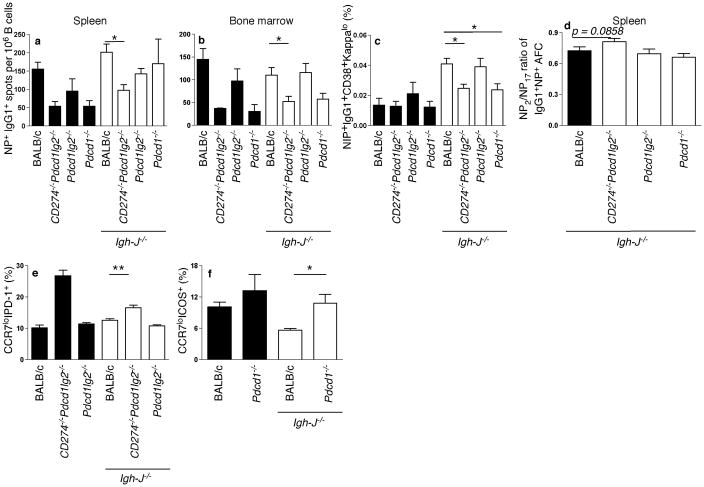
Memory B and plasma cells (PCs) are generated in the germinal center (GC). Because follicular helper T cells (T(FH) cells) have high expression of the immunoinhibitory receptor PD-1, we investigated the role of PD-1 signaling in the humoral response. We found that the PD-1 ligands PD-L1 and PD-L2 were upregulated on GC B cells. Mice deficient in PD-L2 (Pdcd1lg2(-/-)), PD-L1 and PD-L2 (Cd274(-/-)Pdcd1lg2(-/-)) or PD-1 (Pdcd1(-/-)) had fewer long-lived PCs. The mechanism involved more GC cell death and less T(FH) cell cytokine production in the absence of PD-1; the effect was selective, as remaining PCs had greater affinity for antigen. PD-1 expression on T cells and PD-L2 expression on B cells controlled T(FH) cell and PC numbers. Thus, PD-1 regulates selection and survival in the GC, affecting the quantity and quality of long-lived PCs.


Conflict of interest statement

Conflict of Interest Statement

The authors have no conflicts of interest.

Figures

Figure 1
Figure 1. Differential expression of PD-1 and its ligands by B cell subsets
Representative flow cytometry analysis of B6 mice immunized with NP-CGG in alum (n = 3–5) 12 days post-immunization. Splenic CD19+EMA cells were analyzed for NIP-binding and expression of Fas (a), and were gated as follows: NIPFas (naïve, thin solid histogram), NIPintFashi (GC, dashed histogram) and NIP+Fas+ (emerging memory, thick solid histogram). B cell populations were then examined for expression of PD-L2 (b), PD-L1 (c) and PD-1 (d). Frequency (ei) and kinetics (jn) of B7 family members and PD-1 on B cell subsets 12 days, and 4 and 14 wks post-immunization. The CD19+NIP+IgG1+CD38+kappalo phenotype was used to identify memory B cells 14 wks post-immunization due to the very low frequency of detectable cells. (en): points are means and error bars are SEM. Data are representative of at least three independent experiments.
Figure 2
Figure 2. Long-lived PCs are decreased in the absence of PD-1 signaling
Analysis of long-lived PC and memory responses at least 12 weeks post-immunization with alum (n ≥ 5) or NP-CGG. (ac) ELISpot analysis of spleen and BM from Pdcd1lg2−/− (a; n ≥ 16), CD274−/−Pdcd1lg2−/− (b, n ≥ 10), Pdcd1−/− (c; n ≥ 14) (open bars) or wild-type (WT) controls (black bars). (d) Live splenocytes were gated on CD19+NIP+IgG1+CD38+kappalo to assess memory B cell frequency. The CD38 marker was included to gate out any residual GC B cells (which are CD38). Because naïve B cells are also CD38+, IgG1 was included to separate memory B cells from naïve B cells, although this precludes analysis of any present IgM+ memory B cells. (eg) Frequency of memory B cells in Pdcd1lg2−/− (e), CD274−/−Pdcd1lg2−/− (f) and Pdcd1−/− (g) mice (open symbols) compared to WT controls (closed symbols). *P < 0.05, **P < 0.01, ***P < 0.001. Data are combined from two (CD274−/−Pdcd1lg2−/−) or seven (Pdcd1lg2−/− and Pdcd1−/−) independent experiments.
Figure 3
Figure 3. The reduction in PC numbers occurs during the late GC response, and affects both IgG1 and IgM Ab
(ac) ELISpot analysis of NP+IgG1+ AFCs in spleen and BM from WT controls (black bars) or Pdcd1lg2−/− (a, n ≥ 6 for WT and mutant strain), CD274−/−Pdcd1lg2−/− (b, n ≥ 10) or Pdcd1−/− (c, n ≥ 12; open bars) mice immunized with alum (n = 3–9 for all genotypes) or NP-CGG ~4 wks post-immunization. Data is combined from at least two independent experiments. Pdcd1lg2−/− (d), CD274−/−Pdcd1lg2−/− (e), Pdcd1−/− (f) or WT controls were immunized with NP-CGG or alum alone and NP+IgG1+ AFCs in spleen and BM assessed at multiple time-points post-immunization (d28 includes d27-d31, as shown also in ac; d12 also shown in Supplementary Fig. 1, >d84 in Fig. 2). For all time-points except for CD274−/−Pdcd1lg2−/− d18 and d21, data are combined from multiple independent experiments. (g,h) Circulating IgG1 and IgM in Pdcd1lg2−/− (g; n = 6–8), Pdcd1−/− (h; n = 6) or WT at wk4 and wk3 post-immunization, respectively. *P < 0.05, **P < 0.01, ***P < 0.001. Data are representative of at least two independent experiments from wks 3–4.
Figure 4
Figure 4. Increased cell death but normal proliferation in the GCs of Pdcd1−/− mice
WT (closed symbols) and Pdcd1−/− B6 (open symbols) mice immunized with NP-CGG, were pulsed with 3 mg/mouse of BrdU 2hr before analysis. Splenic CD19+NIPintFashi cells undergoing cell death were revealed by detection of activated caspases using CaspGLOW immediately after cell harvest at the timepoints: d10, 12 (also shown in Supplementary Fig. 1), 14, 15, 18 and 21 post-immunization. (a) Sample flow cytometry data of CaspGLOW and BrdU staining from an immunized B6 mouse at d12. (bd) Summary of frequencies derived from flow cytometry analysis of splenic GC B cells (b) that are CaspGLOW+ (c) and BrdU+ (d) over time. (e) Flow cytometry analysis of emerging memory cells and plasmablasts/PCs that are CaspGLOW+; n ≥ 4 per time point. (f) NP2-BSA or NP17-BSA was used as capture Ag for ELISpot and the ratio of NP2 versus NP17-specific IgG1+ BM AFCs for knockout (open histogram; n ≥ 6) and WT mice (closed histogram) were plotted. *P < 0.05, **P < 0.01, ***P < 0.001. Data are combined from, or are representative of, at least two independent experiments.
Figure 5
Figure 5. An increase of cells of a TFH phenotype correlates with a decrease in cytokine production in the absence of PD-1 signaling
(ac) CD274−/−Pdcd1lg2−/−, Pdcd1lg2−/−, Pdcd1−/− and WT mice were immunized with NP-CGG and CD4+CD90.2+EMA cells were gated for the TFH markers of PD-1 expression and CCR7 downregulation, or ICOS expression and CCR7 downregulation for Pdcd1−/− and corresponding WT mice. (a,b) Flow cytometry analysis of TFH frequency among CD4 cells (a) and number (b) in CD274−/−Pdcd1lg2−/− and WT mice d12, d15 and d18 post-immunization. (c) TFH frequency in Pdcd1lg2−/−, Pdcd1−/− and WT mice d15 post-immunization (n = 3–5). Data are representative of at least two independent experiments during the late GC response. (d) Pdcd1−/− and WT mice were immunized with NP-CGG in alum and sorted for ICOS expression and CCR7 downregulation (d12, n = 3), in conjunction with CXCR5 expression (d15, n = 2; d18, n = 3). Il4, Il21 and Ifng expression was assessed by qPCR. Data are shown as fold change as calculated by 2(actin Ct − cytokine Ct). *P < 0.05, **P < 0.01, ***P < 0.001. n.s. = no significance. Each time point is a separate independent experiment.
Figure 6
Figure 6. Decrease in AFCs is due to impaired interactions between PD-ligands on B cells and PD-1 on T cells
(a,b) Schematic representation of the B cell transfer system (a) and T cell transfer system (b). (c,d) ELISpot analysis of NP+IgG1+ AFCs in spleen and BM from AM14 Vκ8R recipient mice of transferred control B cells (black bar) or B cells from Pdcd1lg2−/−B1-8+/−(c; >day 63; n = 16) or Pdcd1lg2−/− (d; day 26–28; n = 14–15) mice (open bar) immunized with alum or NP-CGG. Data are combined from three (c) or four (d) independent experiments. (eg) Analysis of Pdcd1−/− B and T cell transfers 4 wks post-immunization: (e) ELISpot analysis of splenic NP+IgG1+ AFCs in either AM14 Vκ8R recipients of transferred B cells (n = 8), or OT-II recipients of transferred T cells (n = 14), from B6 WT mice (black bar) or Pdcd1−/− mice (open bar). (f,g) Frequency and number of NIP+IgG1+CD38+kappalo B cells after transfer of WT (closed symbols) or Pdcd1−/− (open symbols) T cells (f) or B cells (g). *P < 0.05, **P < 0.01, ***P < 0.001. Data are combined from two (B cell transfer) or three (T cell transfer) independent experiments.
Figure 7
Figure 7. AFC production, memory B cell formation and TFH are altered in mixed BM chimeras
Mixed BM chimeras were made by mixing Igh-J−/− BM with Pdcd1lg2−/−, CD274−/− Pdcd1lg2−/−, Pdcd1−/− or BALB/c BM at a 80:20% ratio, and injecting into lethally irradiated BALB/c recipients (white bars). Black bars represent mice that received BM only from WT or knockout mice (without Igh-J−/− BM). Mice were assessed for degree of chimerization, which approximated the above ratio (not shown). Mice were rested for 6 wks before immunization with NP-CGG. Mice were assessed at d25–26 post-immunization (Igh-J−/−:BALB/c: n = 19, Igh-J−/−:Pdcd1lg2−/−: n = 12, Igh-J−/−:CD274−/−Pdcd1lg2−/−: n = 8, Igh-J−/−:Pdcd1−/−: n = 5). (a,b,d) ELISpot analysis of mixed BM chimeras in the spleen (a,c) and BM (b). (c, eg) flow cytometry analyses of memory B cell frequency (of CD19+ cells; c) and TFH cell frequency (of CD4+CD90.2+ cells; Igh-J−/−: BALB/c: n = 15, Igh-J−/−:Pdcd1lg2−/−: n = 9, Igh-J−/−:CD274−/−Pdcd1lg2−/−: n = 4; Igh-J−/−: Pdcd1−/−: n = 5; e,f) as described in the text. *P < 0.05, **P < 0.01, ***P < 0.001. Data are combined from or are representative of two independent experiments.

Comment in

  • Give and take in the germinal center.
    Nutt SL, Tarlinton DM. Nutt SL, et al. Nat Immunol. 2010 Jun;11(6):464-6. doi: 10.1038/ni0610-464. Nat Immunol. 2010. PMID: 20485272 No abstract available.

Similar articles

Cited by

References

    1. Joshi NS, Kaech SM. Effector CD8 T cell development: a balancing act between memory cell potential and terminal differentiation. J Immunol. 2008;180:1309–1315. - PubMed
    1. Han S, et al. Cellular interaction in germinal centers. Roles of CD40 ligand and B7-2 in established germinal centers. Journal of Immunology. 1995;155:556–567. - PubMed
    1. Jacob J, Kelsoe G, Rajewsky K, Weiss U. Intraclonal generation of antibody mutants in germinal centres. Nature. 1991;354:389–392. - PubMed
    1. Jacob J, Przylepa J, Miller C, Kelsoe G. In situ studies of the primary immune response to (4-hydroxy-3-nitrophenyl)acetyl. III. The kinetics of V region mutation and selection in germinal center B cells. J Exp Med. 1993;178:1293–1307. - PMC - PubMed
    1. Takahashi Y, et al. Relaxed negative selection in germinal centers and impaired affinity maturation in bcl-xL transgenic mice. J Exp Med. 1999;190:399–410. - PMC - PubMed

Publication types

Substances