. 2010 Jun;13(6):723-30.
doi: 10.1038/nn.2546. Epub 2010 May 9.

Representation and transformation of sensory information in the mouse accessory olfactory system

Affiliations

Representation and transformation of sensory information in the mouse accessory olfactory system

Julian P Meeks et al. Nat Neurosci. 2010 Jun.

Abstract

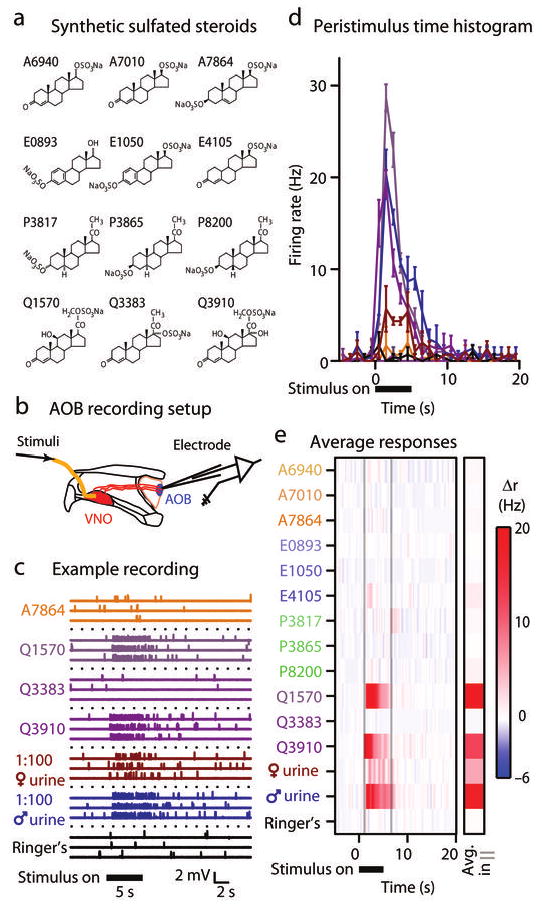
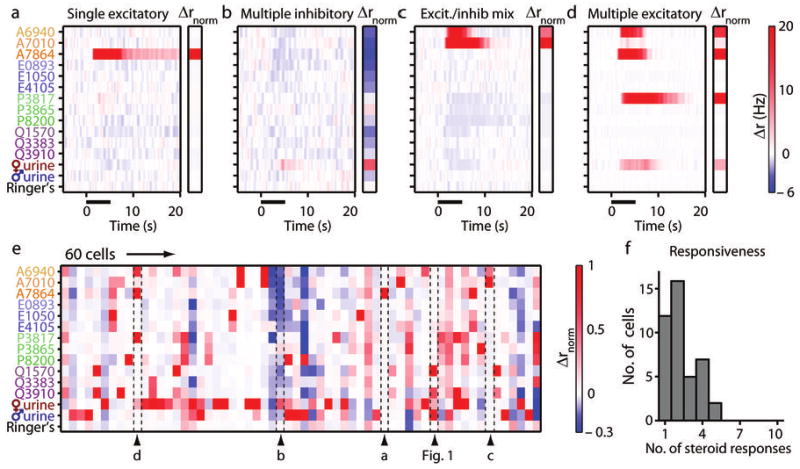
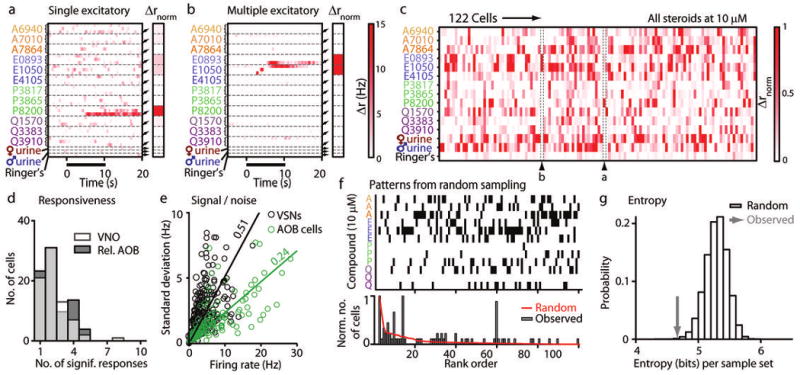
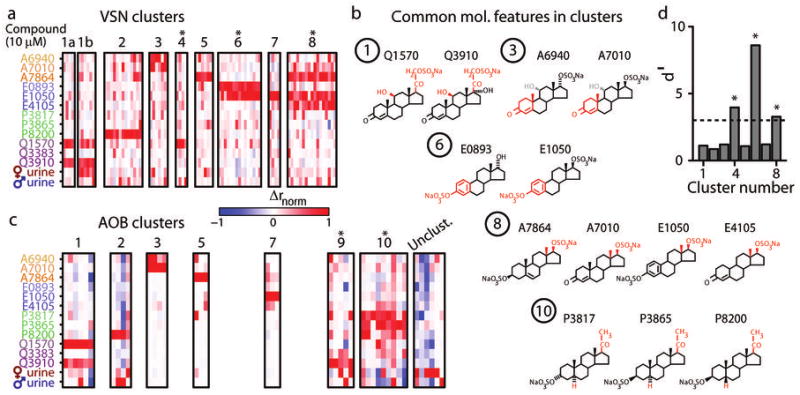
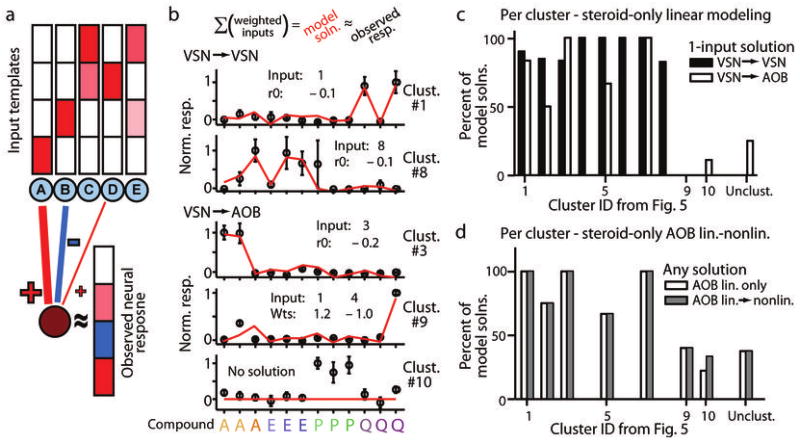
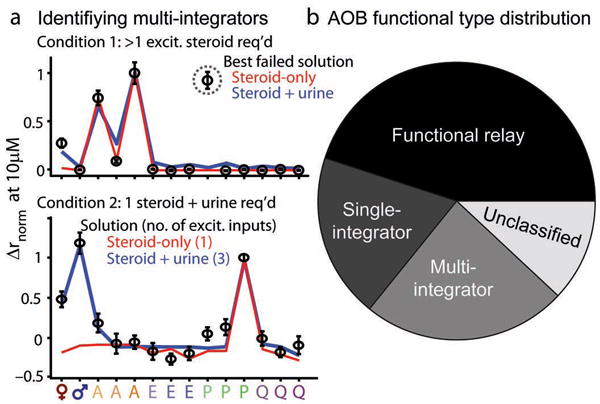
In mice, nonvolatile social cues are detected and analyzed by the accessory olfactory system (AOS). Here we provide a first view of information processing in the AOS with respect to individual chemical cues. 12 sulfated steroids, recently discovered mouse AOS ligands, caused widespread activity among vomeronasal sensory neurons (VSNs), yet VSN responses clustered into a small number of repeated functional patterns or processing streams. Downstream neurons in the accessory olfactory bulb (AOB) responded to these ligands with enhanced signal/noise compared to VSNs. Although the dendritic connectivity of AOB mitral cells suggests the capacity for broad integration, most sulfated steroid responses were well-modeled by linear excitatory drive from just one VSN processing stream. However, a substantial minority demonstrated multi-stream integration. Most VSN excitation patterns were also observed in the AOB, but excitation by estradiol sulfate processing streams was rare, suggesting AOB circuit organization is specific to the biological relevance of sensed cues.


Figures

Figure 1
Figure 1
AOB cells respond strongly to sulfated steroids. (a) Structures of the 12 synthetic sulfated steroids used in our study, identified by their catalog number. (b) Ex vivo recording preparation. We isolated and maintained one hemisphere of the mouse skull containing the intact, connected VNO and AOB in a tissue chamber at 33-35° C. We made extracellular recordings from the AOB while delivering stimuli to the VNO. (c) Example extracellular voltage recording from a single cell in response to 4 of the 12 synthetic sulfated steroids used in the study (all at 10 μM), 1:100 dilute BALB/c female and male urine, and control Ringer's saline solutions. Responses to 3 presentations are shown for these stimuli. Upward ticks correspond to single action potentials. (d) Peristimulus time histogram from the same neuron. Solid horizontal bar shows time of stimulus delivery to the VNO. Error bars represent standard error of the mean across trials (6 trials per stimulus). (e) Colorized plot of the change in firing rate (Δr) during stimulus trials. The single column marked “Avg in | |” indicates the average change in firing rate inside the window between the faint vertical lines. This cell responded strongly to BALB/c male urine and two sulfated glucocorticoids (Q1570: corticosterone 21-sulfate; Q3910: hydrocortisone 21-sulfate) that differ in their structure only by a hydroxyl group at carbon 17.
Figure 2
Figure 2
AOB cell population responses to synthetic sulfated steroids. (a-d) Colorized average Δr responses from 4 example AOB neurons. Stimulus presentation is marked by solid black bar. Insets to the right of each plot indicate the normalized Δr response (Δrnorm) of the neuron for each stimulus. The color scale for Δrnorm is shown to the right of panel e. (a) A cell that responded to a single sulfated androgen, A7864 (5-androsten-3β, 17β-diol disulfate). (b) A cell inhibited by several sulfated steroids with little excitatory input. (c) A cell strongly activated by A6940 (epitestosterone sulfate) and A7010 (testosterone sulfate), and broadly inhibited by other steroids and BALB/c female urine. (d) A cell that responded to the same compound as the cell in panel a, another 19-carbon sulfated steroid (A6940), and a 21-carbon sulfated steroid (P3817: allopregnanolone sulfate). (e) Δrnorm during the window from 1 to 6 seconds post-stimulus for the 60 responsive AOB neurons in this study. Labeled arrowheads indicate the position in the array of the cells shown in panels a-d and Figure 1. (f) Histogram of the total number of significant responses to sulfated steroids per cell (42 steroid-responsive AOB neurons total).
Figure 3
Figure 3
VSN population responses to synthetic sulfated steroids. (a-b) Colorized average Δr responses from 2 example VSNs to 3 concentrations of each steroid (100 nM, 1 μM, and 10 μM, from top to bottom within each dashed boundary). Stimulus presentation is marked by solid black bar. Insets indicate the Δrnorm response of the neuron to 10 μM steroids, male and female urine, and Ringer's control solution. (a) A cell that responded only to the sulfated pregnanolone, P8200. (b) A cell that responded to E0893 and E1050. (c) Colorized, Δrnorm for 122 responsive VSNs. Labeled arrowheads indicate the position in the array of the cells shown in panels a and b. (d) Histogram of the total number of significant responses to individual sulfated steroids at 10 μM per VSN (transparent white bars in foreground). The relative responsiveness histogram for AOB neurons from Figure 2f is re-plotted in gray in the background. (e) Plot of the response amplitude (abscissa) versus the standard deviation of that response across trials (ordinate) of all statistically significant VSN and AOB responses to stimulation (black and green circles, respectively). Solid lines indicate linear regression lines (VSN slope: 0.51; AOB slope: 0.24). (f) Comparison of observed binary response patterns with expectations from random sampling. Top: the most frequently expected binary response patterns in VSNs expected from random sampling (sorted by rank). Bottom: distribution of occurrences of each pattern above for simulated data (red trace) and observed data (filled gray bars). (g) Entropy of simulated (open bars) and observed data (gray arrow). The probability of encountering a data set with such a low entropy value is less than 10−3 by random sampling.
Figure 4
Figure 4
Sensory responses to sulfated steroids can be grouped into functional categories. (a) We identified 8 clusters of similar responsiveness to sulfated steroids at 10 μM identified in the VSN data set. We show normalized Δrmonotonic responses of the 75 steroid-responsive VSNs in their respective clusters. Asterisks indicate clusters we did not encounter in the AOB data set. Cluster 1 included several neurons that responded to 1:100 female mouse urine, and others that did not. As these may represent functionally separable populations, we separated them into urine-unresponsive (cluster 1a) and urine-responsive (cluster 1b) subgroups. (b) Molecular features that, for clusters 1, 3, 6, 8, and 10, distinguished active from inactive steroids. Common features are highlighted in red. The grayed groups in cluster 3 indicated that a distinguishing feature of steroids that activate neurons in this cluster is the lack of a hydroxyl group at carbon 13. (c) We identified clusters of responsiveness to sulfated steroids at 10 μM in the AOB neuron data set independently of the VSN cluster identities. We show Δrnorm responses of AOB neurons in their respective clusters. The “unclustered” region shows the neurons most associated with marginally-responsive neurons. Asterisks indicate clusters we did not encounter in the VSN data set. (d) Discriminability index (d′) comparing the steroid response patterns found in the VSN data set to the AOB data set along the first 3 linear discriminant eigenvectors. The dotted line indicates d′ = 3, corresponding to a high degree of separability. Asterisks indicate clusters not present in the AOB data set.
Figure 5
Figure 5
A linear integration model indicates most AOB neurons receive functional input from a single defined processing stream. (a) Model schematic. We supplied VSN cluster means as potential inputs to AOB cells. Hypothetical responses to 4 single molecules are shown above each hypothetical input template (blue circles labeled A-E). The maroon circle at the bottom represents a hypothetical observed AOB cell, and its response to all 4 single molecules is displayed to the right. We modeled AOB cell responses by adding one weighted template at a time until a fit reached our statistical criterion. Red hues indicate positive changes in firing rate, or an excitatory coupling, and blue hues indicate negative changes in firing rate, or an inhibitory coupling. (b) Examples of linear model solutions for two VSNs and three AOB cells. Open circles designate mean observed responses; error bars represent standard errors of the mean. The red line indicates the linear model solution with the fewest linear inputs. “Input” refers to the identity of the VSN input types (by cluster ID in Fig. 4a). “r0” refers to the linear offset. “Wts” refers to the linear weights assigned to respective inputs. (c) Percentage of linear modeling attempts for VSNs (filled bars) and AOB cells (open bars) that satisfactorily fit observed responses using a single template. Model performance is grouped by cluster number from Figure 4. (d) Percentage of linear and linear-nonlinear model attempts (open and gray bars, respectively) that successfully accounted for AOB response patterns with any number of inputs.
Figure 6
Figure 6
Residuals of model fitting reveal input patterns missing in the VSN data set. (a) The AOB responses identified as cluster 10 showed excitation to multiple members of the pregnanolone class of steroids at 10 μM, but we did not observe such a response profile in VSNs at 10 μM. Investigation of VSN responses in a separate dataset revealed broad pregnanolone responses, shown on the log-linear plot, but only at concentrations > 10 μM. These neurons tended also to respond to 1:100 BALB/c female urine. The gray shaded region indicates the concentration range sampled in the main VSN dataset used for clustering analysis. (b) Cluster analysis of linear-nonlinear model fit residuals indicated 3 common patterns unaccounted for in the VSN input population (labeled A-C). Heat map indicates the power in the residuals for each of the 12 sulfated steroids, measured in terms of the ratio between the value and uncertainty (z-score).
Figure 7
Figure 7
Summary of observed response patterns in AOB neurons. (a) Identification of “multi-integrator” AOB neurons receiving excitatory inputs from two or more processing streams. (top) Best unsuccessful linear-nonlinear model fitting for steroid-only (red trace) and steroid-plus-urine (blue trace) data. Open black symbols indicate the observed normalized firing rates; error bars represent standard errors of the mean. Neither attempt was able to account for the large excitatory response to P3817 (dotted gray circle). (bottom) Linear-nonlinear solutions for a cell identified as a “single integrator” by steroid-only fits (red trace) and as a “multi-integrator” when urine responses were included (blue trace). (b) Proportion of AOB neurons falling into four categories based on linear-nonlinear model results. “Unclassified” cells did not meet the criteria for classification in the three main categories.

References

    1. Dulac C, Kimchi T. Neural mechanisms underlying sex-specific behaviors in vertebrates. Curr Opin Neurobiol. 2007;17:675–683. - PMC - PubMed
    1. Keller M, Baum MJ, Brock O, Brennan PA, Bakker J. The main and the accessory olfactory systems interact in the control of mate recognition and sexual behavior. Behav Brain Res. 2009;200:268–276. - PubMed
    1. Touhara K, Vosshall LB. Sensing odorants and pheromones with chemosensory receptors. Annu Rev Physiol. 2009;71:307–332. - PubMed
    1. Martini S, Silvotti L, Shirazi A, Ryba NJ, Tirindelli R. Co-expression of putative pheromone receptors in the sensory neurons of the vomeronasal organ. J Neurosci. 2001;21:843–848. - PMC - PubMed
    1. Rodriguez I, Del Punta K, Rothman A, Ishii T, Mombaerts P. Multiple new and isolated families within the mouse superfamily of V1r vomeronasal receptors. Nat Neurosci. 2002;5:134–140. - PubMed

Publication types

MeSH terms