. 2010 Jun;6(6):424-32.
doi: 10.1038/nchembio.368. Epub 2010 May 9.

Endoplasmic reticulum Ca2+ increases enhance mutant glucocerebrosidase proteostasis

Affiliations

Endoplasmic reticulum Ca2+ increases enhance mutant glucocerebrosidase proteostasis

Derrick Sek Tong Ong et al. Nat Chem Biol. 2010 Jun.

Erratum in

  • Nat Chem Biol. 2010 Aug;6(8):630

Abstract

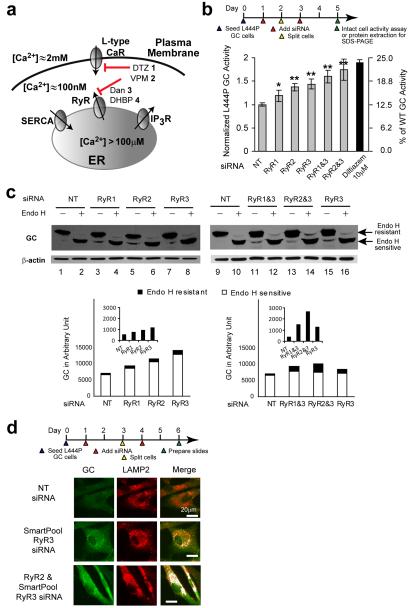
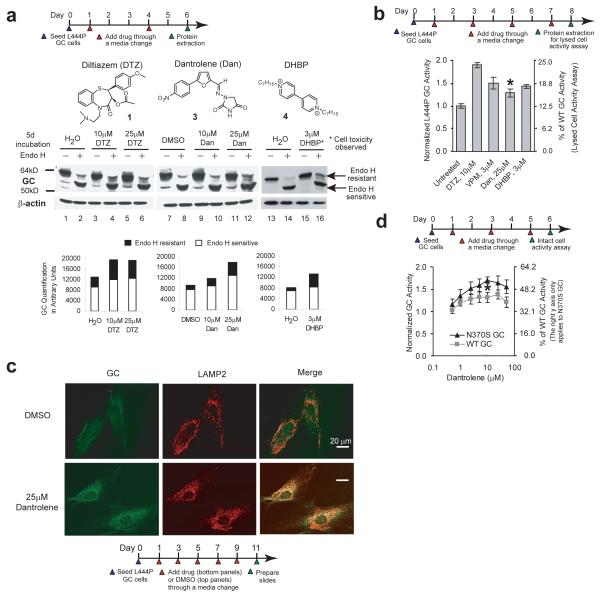
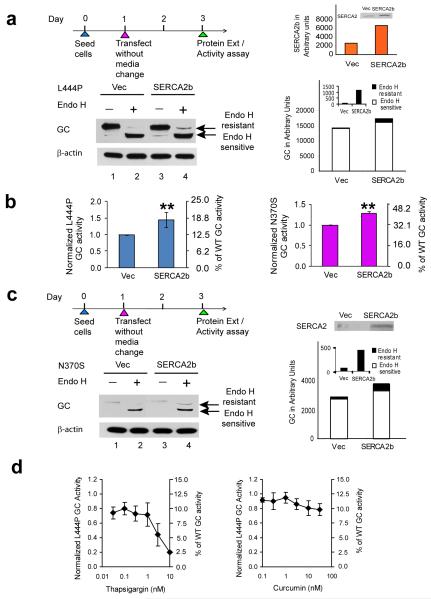
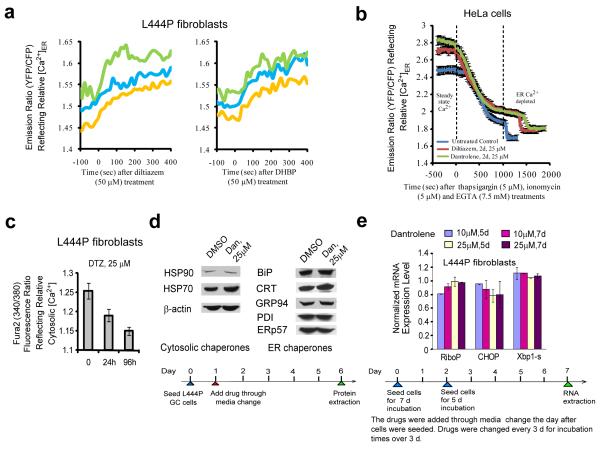
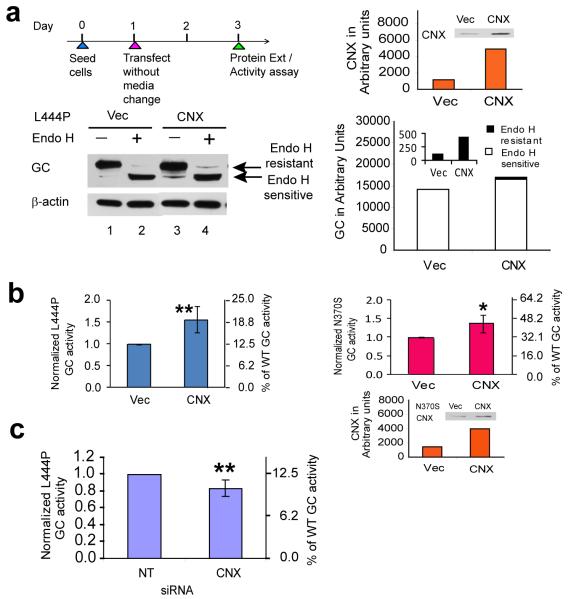
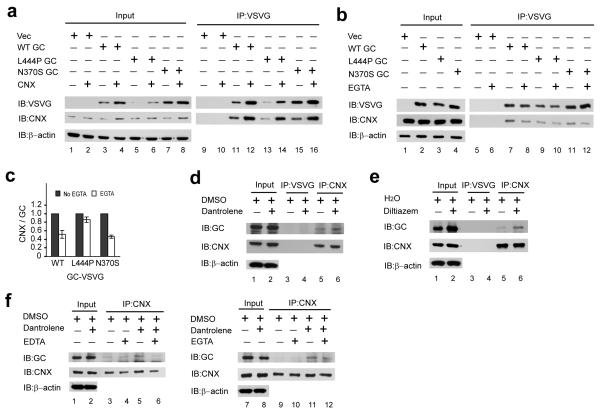
Altering intracellular calcium levels is known to partially restore mutant enzyme homeostasis in several lysosomal storage diseases, but why? We hypothesized that endoplasmic reticulum (ER) calcium increases enhance the folding, trafficking and function of these mutant misfolding- and degradation-prone lysosomal enzymes by increasing chaperone function. Here we report that increasing ER calcium levels by reducing ER calcium efflux through the ryanodine receptor, using antagonists or RNAi, or by promoting ER calcium influx by SERCA2b overexpression enhances mutant glucocerebrosidase (GC) homeostasis in cells derived from individuals with Gaucher's disease. Post-translational regulation of the calnexin folding pathway by an elevated ER calcium concentration seems to enhance the capacity of this chaperone system to fold mutant misfolding-prone enzymes, increasing the folded mutant GC population that can engage the trafficking receptor at the expense of ER-associated degradation, increasing the lysosomal GC concentration and activity.


Figures

Figure 1
Figure 1
siRNA-mediated knockdown of RyR isoforms partially restores L444P GC proteostasis. (a) Intra-ER Ca2+ concentration is regulated by L-type voltage-gated Ca2+ channels, ryanodine receptor (RyRs) Ca2+ efflux channels, IP3 receptor Ca2+ efflux channels, and SERCA Ca2+ influx pumps. (b) Relative lysosomal GC activities of L444P fibroblasts upon single or double RyR1, RyR2 and RyR3 siRNA treatments, using the intact cell assay. Reported activities were normalized to the activity of cells treated with non-targeting siRNA (*, p<0.01; **, p<0.001). The experiments were repeated three times. The data are reported as mean ± SD. Statistical significance was evaluated using a two-tailed Student’s t-Test. The diltiazem data has been reported previously and is included to enable comparison with RyR(s) siRNA treatment. (c) Western blot analysis of L444P fibroblast lysates without and with endo H treatment after the corresponding siRNA treatments. Co-application of siRNAs that target the RyR3 and another RyR isoform led to a significant increase in the endo H resistant post-ER GC glycoform bands in comparison to the non-targeting siRNA control. The white portion of the bars represents quantification (Java Image processing and analysis software from the NIH) of the lower, endo H sensitive bands, and the black portion of the bars represents the higher MW, endo H resistant post-ER glycoform. (d) Indirect immunofluorescence microscopy of GC in L444P fibroblasts reveals that the application of siRNA against RyR3 or siRNA against RyR2 and RyR3 enhances GC staining (green) and the colocalization between GC and LAMP2 (artificially colored white).
Figure 2
Figure 2
Ryanodine receptor antagonists act as GC proteostasis regulators. (a) Small molecules that inhibit the RyRs enhance folding and trafficking of the L444P GC protein in L444P fibroblasts. The significant increase in endo H resistant post-ER GC glycoform when compared to the vehicle controls reflects increased GC proteostasis. Quantification of GC bands is shown in the bar graphs at the bottom of (a). (b) Diltiazem 1, dantrolene 3 and DHBP 4 increase L444P GC enzyme activity (lysed cell activity assay), normalized to the vehicle controls (*, p<0.001). The verapamil 2 data, reported previously, is included for comparison. (c) Indirect immunofluorescence microscopy of GC in L444P fibroblasts reveals that dantrolene 3 treatment enhances GC staining (green) and colocalization between GC and LAMP2 (artificially colored white). The experiments were repeated three times. (d) Dantrolene 3 increases WT and N370S GC enzyme activity (intact cell assay) in patient-derived fibroblasts, normalized to the vehicle control (*, p<0.001). Data in (b), and (d) are reported as mean ± SEM, statistical significance was evaluated using a two-tailed Student’s t-Test.
Figure 3
Figure 3
Overexpression of the SERCA2b Ca2+ influx pump enhances mutant GC folding and trafficking. Transient overexpression of SERCA2b in L444P GC patient-derived fibroblasts for 2 d resulted in a significant increase in (a) the endo H resistant post-ER GC glycoform as well as (b) lysosomal GC enzyme activity (**, p<0.001) when compared to the empty vector control. An analogous increase in (b) lysosomal GC enzyme activity (**, p<0.001) and (c) endo H resistant post-ER GC glycoform band was also observed when SERCA2b was transiently overexpressed in N370S GC patient-derived fibroblasts. The L444P and N370S GC protein glycosylation pattern was analyzed by western blot analysis after endo H digestion as described in Fig. 1. The orange bars represent the level of SERCA2b expression in the fibroblasts. Incubation of the L444P fibroblasts with (d) thapsigargin 12, a potent inhibitor of the SERCA2 pump, for 7 d significantly decreased the L444P GC lysosomal enzyme activity. All the experiments were repeated three times. Data in (b) and (d) are reported as mean ± SD. Statistical significance was evaluated using a two-tailed Student’s t-Test.
Figure 4
Figure 4
Antagonists of the RyRs increase [Ca2+]ER in fibroblasts and HeLa cells, but do not activate the HSR and UPR in the L444P fibroblasts. (a) Diltiazem 1 (50 μM) and DHBP 4 (50 μM) treatment increased the [Ca2+]ER over the course of 400 sec in the L444P fibroblasts transfected with the D1-ER cameleon Ca2+ sensor 48 h prior. Each trace represents the time dependent emission ratio of YFP/CFP immediately after a single dose. (b) Two day treatment of HeLa cells with diltiazem 1 (25 μM) and dantrolene 3 (25 μM) increased the steady state [Ca2+]ER; revealed by first measuring the YFP/CFP ratio after 48 h treatment (drug-treated steady state Ca2+) and second, by treatment with thapsigargin 12 (5 μM)/ionomycin 15 (5 μM) and EGTA 16 (7.5 mM) to generate the ER Ca2+-depleted state (minimum YFP/CFP ratio). The ER depletion time courses shown represent an average of 12 cells. (c) Diltiazem 1 (25 μM) decreased the steady state cytosolic Ca2+ levels in the L444P fibroblasts over a 1 and 4 d period using Fura2, AM. (d) Dantrolene 3 (25 μM) application does not activate the HSR or the UPR, based on western blot analysis of transcriptionally controlled chaperones and folding enzymes. (e) Dantrolene 3 (10 and 25 μM) does not activate the UPR based on qRT-PCR analysis of CHOP and spliced XBP-1. The large ribosomal protein, RiboP, serves as a housekeeping gene control. Data in (b), (c) and (e) are reported as mean ± SD.
Figure 5
Figure 5
Overexpression of calnexin partially restores mutant GC proteostasis. Transient overexpression of calnexin in the L444P GC patient-derived fibroblasts for 2 d resulted in a significant increase in (a) the endo H resistant post-ER GC glycoform bands as well as (b) lysosomal GC enzyme activity (**, p<0.001) when compared to the empty vector control. An analogous increase (*, p<0.01) in the (b) lysosomal GC enzyme activity was also observed when calnexin was transiently overexpressed in the N370S GC patient-derived fibroblasts. (c) The intact cell assay revealed a significant (**, p<0.001) decrease in the lysosomal L444P GC enzyme activity with calnexin knockdown. The L444P GC protein glycosylation pattern was analyzed by western blot analysis after endo H digestion as described in Fig. 1. The orange bars represent the level of calnexin expression in the fibroblasts. All the experiments were repeated three times. Data in (b) and (c) are reported as mean ± SD. Statistical significance was evaluated using a two-tailed Student’s t-Test.
Figure 6
Figure 6
The RyR antagonist category GC proteostasis regulators post-translationally regulate the chaperoning activity of calnexin in a Ca2+-dependent manner. (a) Transient overexpression of calnexin and GC proteins in HeLa cells for 24 h resulted in a significant increase in the total WT, L444P and N370S GC proteins when compared to that with co-transfection of the GC and empty vector plasmids as revealed by western blot analysis. This was due to more calnexin being available to interact with the GC proteins. (b) The calnexin-GC protein interaction is Ca2+-sensitive. Pre-incubation of the lysate with EGTA significantly reduced the calnexin-GC protein interaction. (c) After western blot analysis, the calnexin and GC protein bands were quantified using the ImageJ software (from NIH) and the bars represent the ratio of the calnexin to GC band intensities. The experiments were repeated three times. (d) Dantrolene 3 and (e) diltiazem 1 treatments increase the amount of L444P GC protein that is associated with calnexin, without increasing the calnexin protein level as revealed by western blot analysis. (f) Pre-incubating the RyR antagonist treated lysate with EDTA or EGTA significantly reduces the calnexin-GC protein interaction as revealed by western blot analysis. The experiments were repeated three times.

Comment in

  • Manipulating proteostasis.
    Sifers RN. Sifers RN. Nat Chem Biol. 2010 Jun;6(6):400-1. doi: 10.1038/nchembio.374. Nat Chem Biol. 2010. PMID: 20479748 No abstract available.

Similar articles

Cited by

References

    1. Balch WE, Morimoto RI, Dillin A, Kelly JW. Adapting proteostasis for disease intervention. Science. 2008;319:916–919. - PubMed
    1. Deuerling E, Bukau B. Chaperone-assisted folding of newly synthesized proteins in the cytosol. Crit. Rev. Biochem. Mol. Biol. 2004;39:261–277. - PubMed
    1. Tang YC, Chang HC, Chakraborty K, Hartl FU, Hayer-Hartl M. Essential role of the chaperonin folding compartment in vivo. Embo J. 2008;27:1458–1468. - PMC - PubMed
    1. Bukau B, Weissman J, Horwich A. Molecular chaperones and protein quality control. Cell. 2006;125:443–451. - PubMed
    1. Morimoto RI, Cuervo AM. Protein Homeostasis and Aging: Taking Care of Proteins From the Cradle to the Grave. J. Gerontol. Ser.A-Biol. Sci.Med. Sci. 2009;64A:167–170. - PMC - PubMed

Publication types

MeSH terms