

Syndromic surveillance for local outbreaks of lower-respiratory infections: would it work?
- PMID: 20454449
- PMCID: PMC2861591
- DOI: 10.1371/journal.pone.0010406
Syndromic surveillance for local outbreaks of lower-respiratory infections: would it work?
Abstract
Background: Although syndromic surveillance is increasingly used to detect unusual illness, there is a debate whether it is useful for detecting local outbreaks. We evaluated whether syndromic surveillance detects local outbreaks of lower-respiratory infections (LRIs) without swamping true signals by false alarms.
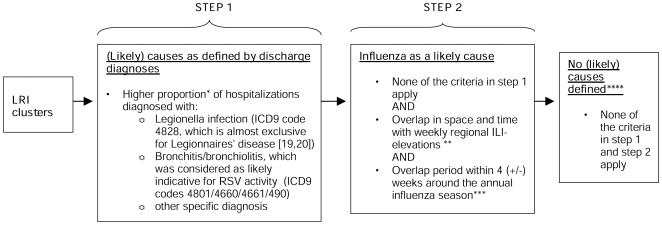
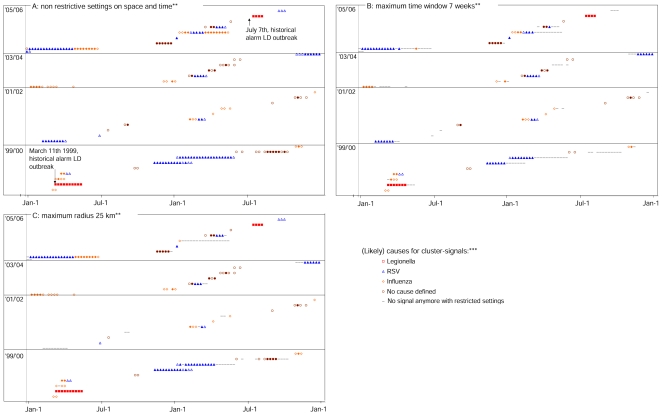
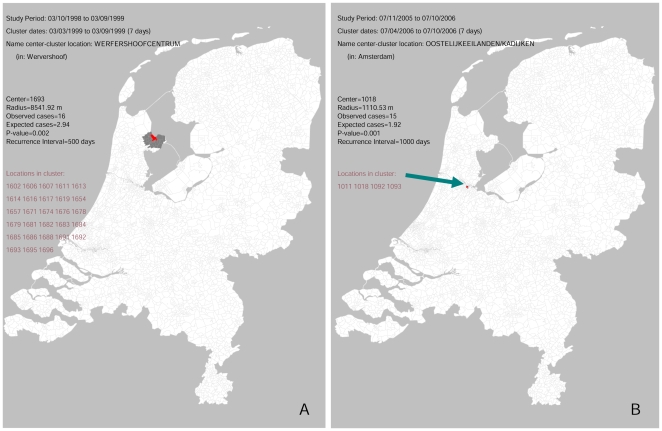
Methods and findings: Using retrospective hospitalization data, we simulated prospective surveillance for LRI-elevations. Between 1999-2006, a total of 290762 LRIs were included by date of hospitalization and patients place of residence (>80% coverage, 16 million population). Two large outbreaks of Legionnaires disease in the Netherlands were used as positive controls to test whether these outbreaks could have been detected as local LRI elevations. We used a space-time permutation scan statistic to detect LRI clusters. We evaluated how many LRI-clusters were detected in 1999-2006 and assessed likely causes for the cluster-signals by looking for significantly higher proportions of specific hospital discharge diagnoses (e.g. Legionnaires disease) and overlap with regional influenza elevations. We also evaluated whether the number of space-time signals can be reduced by restricting the scan statistic in space or time. In 1999-2006 the scan-statistic detected 35 local LRI clusters, representing on average 5 clusters per year. The known Legionnaires' disease outbreaks in 1999 and 2006 were detected as LRI-clusters, since cluster-signals were generated with an increased proportion of Legionnaires disease patients (p:<0.0001). 21 other clusters coincided with local influenza and/or respiratory syncytial virus activity, and 1 cluster appeared to be a data artifact. For 11 clusters no likely cause was defined, some possibly representing as yet undetected LRI-outbreaks. With restrictions on time and spatial windows the scan statistic still detected the Legionnaires' disease outbreaks, without loss of timeliness and with less signals generated in time (up to 42% decline).
Conclusions: To our knowledge this is the first study that systematically evaluates the performance of space-time syndromic surveillance with nationwide high coverage data over a longer period. The results show that syndromic surveillance can detect local LRI-outbreaks in a timely manner, independent of laboratory-based outbreak detection. Furthermore, since comparatively few new clusters per year were observed that would prompt investigation, syndromic hospital-surveillance could be a valuable tool for detection of local LRI-outbreaks.
Conflict of interest statement
Figures
References
-
- Fleming DM, Barley MA, Chapman RS. Surveillance of the bioterrorist threat: a primary care response. Commun Dis Public Health. 2004;7:68–72. - PubMed
-
- Miller M, Roche P, Spencer J, Deeble M. Evaluation of Australia's National Notifiable Disease Surveillance System. Commun Dis Intell. 2004;28:311–323. - PubMed
-
- Ohkusa Y, Shigematsu M, Taniguchi K, Okabe N. Experimental surveillance using data on sales of over-the-counter medications–Japan, November 2003–April 2004. MMWR Morb Mortal Wkly Rep. 2005;54(Suppl):47–52. - PubMed
Publication types
MeSH terms
LinkOut - more resources
Full Text Sources
