

Diverse effects on mitochondrial and nuclear functions elicited by drugs and genetic knockdowns in bloodstream stage Trypanosoma brucei
- PMID: 20454560
- PMCID: PMC2864271
- DOI: 10.1371/journal.pntd.0000678
Diverse effects on mitochondrial and nuclear functions elicited by drugs and genetic knockdowns in bloodstream stage Trypanosoma brucei
Abstract
Background: The options for treating the fatal disease human African trypanosomiasis are limited to a few drugs that are toxic or facing increasing resistance. New drugs that kill the causative agents, subspecies of Trypanosoma brucei, are therefore urgently needed. Little is known about the cellular mechanisms that lead to death of the pathogenic bloodstream stage.
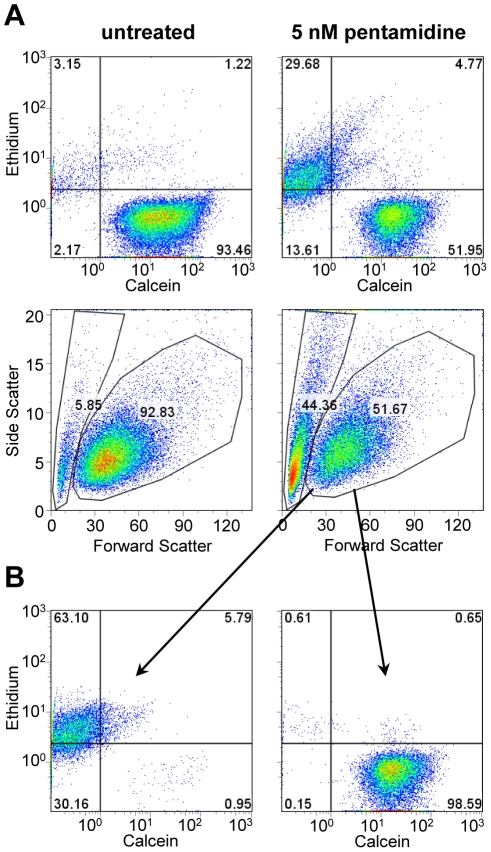
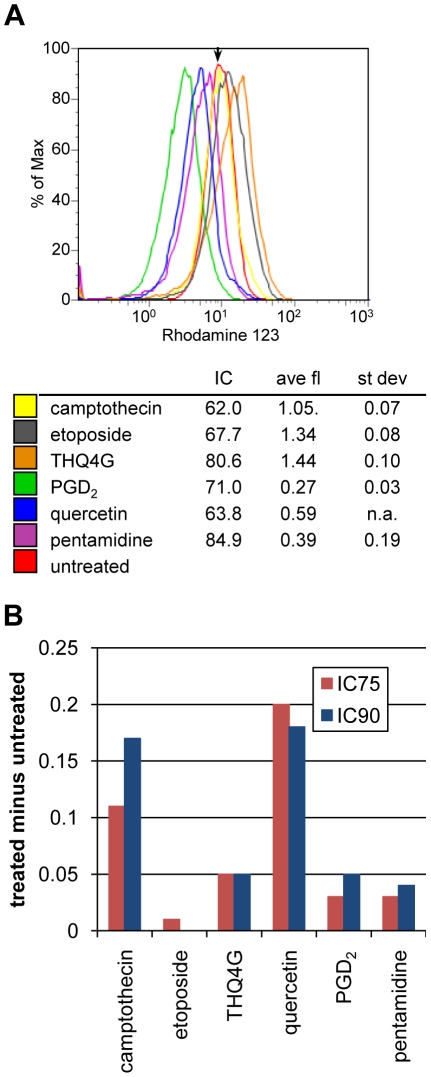
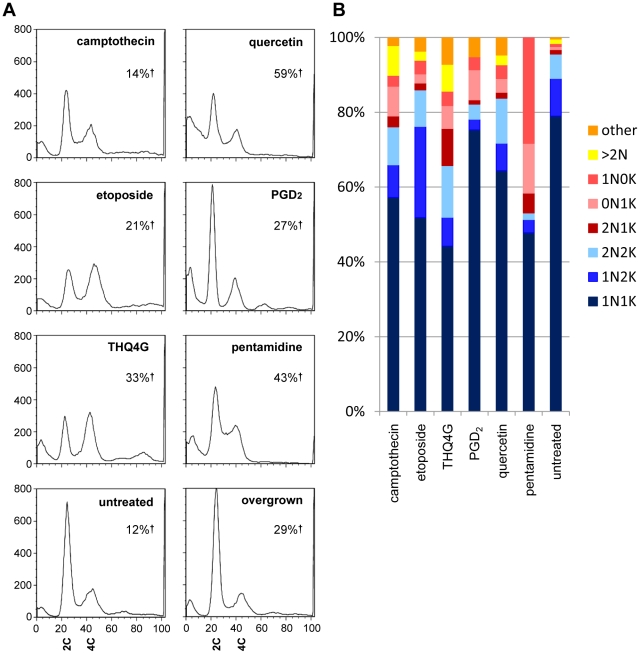
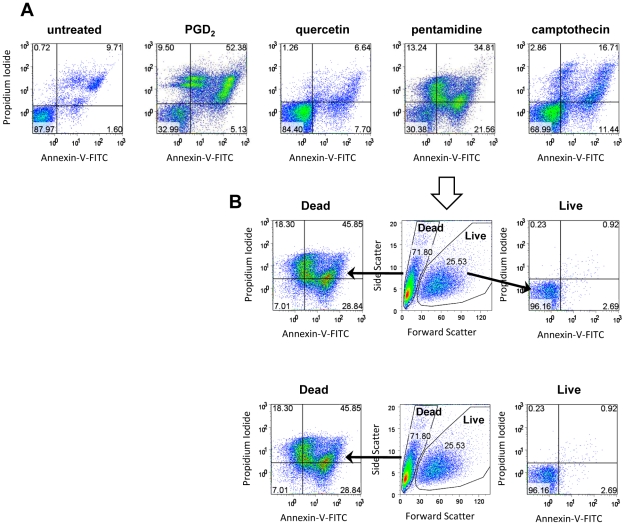
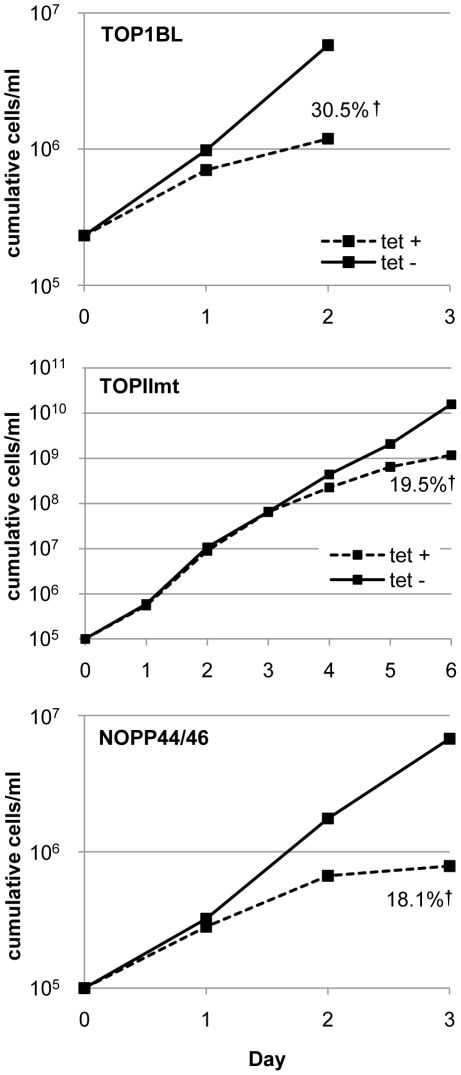
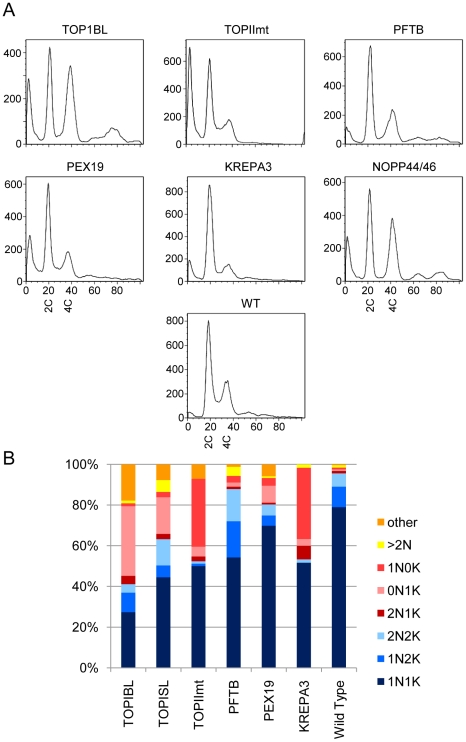
Methodology/principal findings: We therefore conducted the first side by side comparison of the cellular effects of multiple death inducers that target different systems in bloodstream form parasites, including six drugs (pentamidine, prostaglandin D(2), quercetin, etoposide, camptothecin, and a tetrahydroquinoline) and six RNAi knockdowns that target distinct cellular functions. All compounds tested were static at low concentrations and killed at high concentrations. Dead parasites were rapidly quantified by forward and side scatter during flow cytometry, as confirmed by ethidium homodimer and esterase staining, making these assays convenient for quantitating parasite death. The various treatments yielded different combinations of defects in mitochondrial potential, reactive oxygen species, cell cycle, and genome segregation. No evidence was seen for phosphatidylserine exposure, a marker of apoptosis. Reduction in ATP levels lagged behind decreases in live cell number. Even when the impact on growth was similar at 24 hours, drug-treated cells showed dramatic differences in their ability to further proliferate, demonstrating differences in the reversibility of effects induced by the diverse compounds.
Conclusions/significance: Parasites showed different phenotypes depending on the treatment, but none of them were clear predictors of whether apparently live cells could go on to proliferate after drugs were removed. We therefore suggest that clonal proliferation assays may be a useful step in selecting anti-trypanosomal compounds for further development. Elucidating the genetic or biochemical events initiated by the compounds with the most profound effects on subsequent proliferation may identify new means to activate death pathways.
Conflict of interest statement
The authors have declared that no competing interests exist.
Figures
Similar articles
-
Trypanocidal action of bisphosphonium salts through a mitochondrial target in bloodstream form Trypanosoma brucei.Int J Parasitol Drugs Drug Resist. 2015 Dec 11;6(1):23-34. doi: 10.1016/j.ijpddr.2015.12.002. eCollection 2016 Apr. Int J Parasitol Drugs Drug Resist. 2015. PMID: 27054061 Free PMC article.
-
Identification of compounds with anti-proliferative activity against Trypanosoma brucei brucei strain 427 by a whole cell viability based HTS campaign.PLoS Negl Trop Dis. 2012;6(11):e1896. doi: 10.1371/journal.pntd.0001896. Epub 2012 Nov 29. PLoS Negl Trop Dis. 2012. PMID: 23209849 Free PMC article.
-
An Atypical Mitochondrial Carrier That Mediates Drug Action in Trypanosoma brucei.PLoS Pathog. 2015 May 6;11(5):e1004875. doi: 10.1371/journal.ppat.1004875. eCollection 2015 May. PLoS Pathog. 2015. PMID: 25946070 Free PMC article.
-
Chemotherapeutic strategies against Trypanosoma brucei: drug targets vs. drug targeting.Curr Pharm Des. 2007;13(6):555-67. doi: 10.2174/138161207780162809. Curr Pharm Des. 2007. PMID: 17346174 Review.
-
Development of novel drugs for human African trypanosomiasis.Future Microbiol. 2011 Jun;6(6):677-91. doi: 10.2217/fmb.11.44. Future Microbiol. 2011. PMID: 21707314 Review.
Cited by
-
Genetic validation of Trypanosoma brucei glutathione synthetase as an essential enzyme.Eukaryot Cell. 2014 May;13(5):614-24. doi: 10.1128/EC.00015-14. Epub 2014 Mar 7. Eukaryot Cell. 2014. PMID: 24610661 Free PMC article.
-
Insights into antitrypanosomal drug mode-of-action from cytology-based profiling.PLoS Negl Trop Dis. 2018 Nov 26;12(11):e0006980. doi: 10.1371/journal.pntd.0006980. eCollection 2018 Nov. PLoS Negl Trop Dis. 2018. PMID: 30475806 Free PMC article.
-
Quercetin: Its Main Pharmacological Activity and Potential Application in Clinical Medicine.Oxid Med Cell Longev. 2020 Dec 30;2020:8825387. doi: 10.1155/2020/8825387. eCollection 2020. Oxid Med Cell Longev. 2020. PMID: 33488935 Free PMC article. Review.
-
An essential nuclear protein in trypanosomes is a component of mRNA transcription/export pathway.PLoS One. 2011;6(6):e20730. doi: 10.1371/journal.pone.0020730. Epub 2011 Jun 8. PLoS One. 2011. PMID: 21687672 Free PMC article.
-
Three mitochondrial DNA polymerases are essential for kinetoplast DNA replication and survival of bloodstream form Trypanosoma brucei.Eukaryot Cell. 2011 Jun;10(6):734-43. doi: 10.1128/EC.05008-11. Epub 2011 Apr 29. Eukaryot Cell. 2011. PMID: 21531873 Free PMC article.
References
-
- Mackey ZB, Baca AM, Mallari JP, Apsel B, Shelat A, et al. Discovery of trypanocidal compounds by whole cell HTS of Trypanosoma brucei. Chem Biol Drug Des. 2006;67:355–363. - PubMed
-
- Raz B, Iten M, Grether-Buhler Y, Kaminsky R, Brun R. The Alamar Blue assay to determine drug sensitivity of African trypanosomes (T.b. rhodesiense and T.b. gambiense) in vitro. Acta Trop. 1997;68:139–147. - PubMed
-
- Sykes ML, Avery VM. Development of an Alamar Blue viability assay in 384-well format for high throughput whole cell screening of Trypanosoma brucei brucei bloodstream form strain 427. Am J Trop Med Hyg. 2009;81:665–674. - PubMed
-
- Mackey ZB, O'Brien TC, Greenbaum DC, Blank RB, McKerrow JH. A cathepsin B-like protease is required for host protein degradation in Trypanosoma brucei. J Biol Chem. 2004;279:48426–48433. - PubMed
Publication types
MeSH terms
Substances
Grants and funding
LinkOut - more resources
Full Text Sources
