Review
. 2010 May 4;7(5):e1000272.
doi: 10.1371/journal.pmed.1000272.

Anatomy of the epidemiological literature on the 2003 SARS outbreaks in Hong Kong and Toronto: a time-stratified review

Affiliations
Review

Anatomy of the epidemiological literature on the 2003 SARS outbreaks in Hong Kong and Toronto: a time-stratified review

Weijia Xing et al. PLoS Med. .

Abstract

Background: Outbreaks of emerging infectious diseases, especially those of a global nature, require rapid epidemiological analysis and information dissemination. The final products of those activities usually comprise internal memoranda and briefs within public health authorities and original research published in peer-reviewed journals. Using the 2003 severe acute respiratory syndrome (SARS) epidemic as an example, we conducted a comprehensive time-stratified review of the published literature to describe the different types of epidemiological outputs.

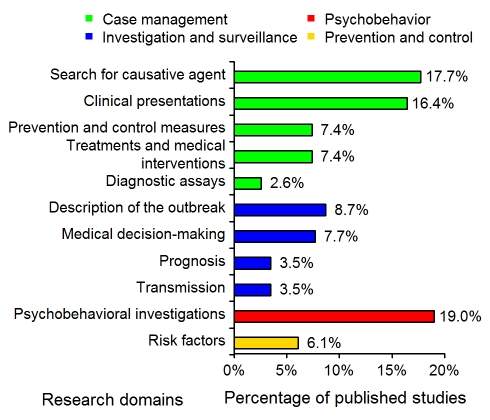
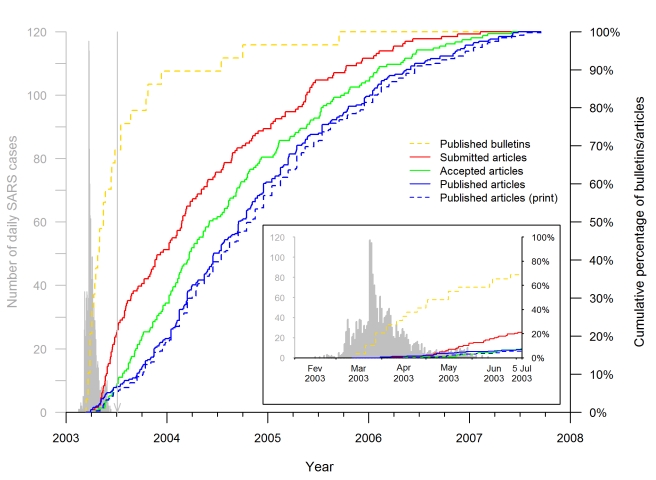
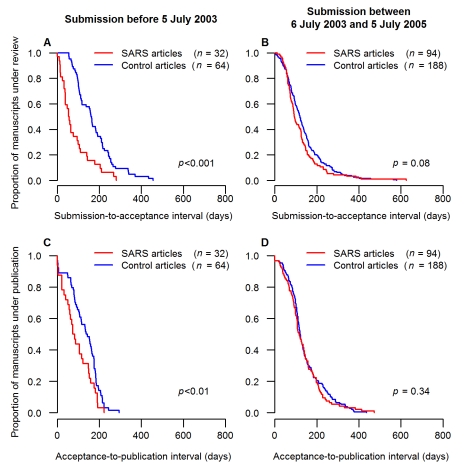
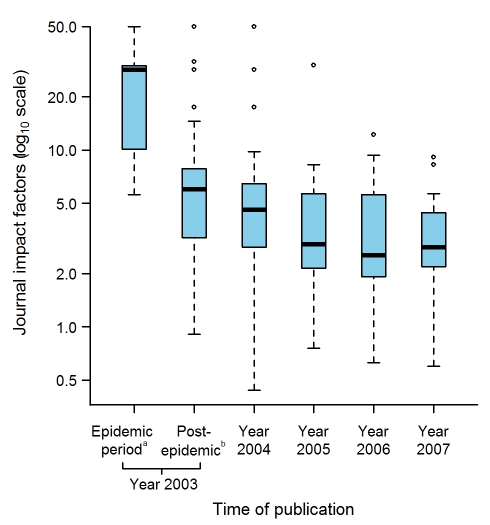
Methods and findings: We identified and analyzed all published articles on the epidemiology of the SARS outbreak in Hong Kong or Toronto. The analysis was stratified by study design, research domain, data collection, and analytical technique. We compared the SARS-case and matched-control non-SARS articles published according to the timeline of submission, acceptance, and publication. The impact factors of the publishing journals were examined according to the time of publication of SARS articles, and the numbers of citations received by SARS-case and matched-control articles submitted during and after the epidemic were compared. Descriptive, analytical, theoretical, and experimental epidemiology concerned, respectively, 54%, 30%, 11%, and 6% of the studies. Only 22% of the studies were submitted, 8% accepted, and 7% published during the epidemic. The submission-to-acceptance and acceptance-to-publication intervals of the SARS articles submitted during the epidemic period were significantly shorter than the corresponding intervals of matched-control non-SARS articles published in the same journal issues (p<0.001 and p<0.01, respectively). The differences of median submission-to-acceptance intervals and median acceptance-to-publication intervals between SARS articles and their corresponding control articles were 106.5 d (95% confidence interval [CI] 55.0-140.1) and 63.5 d (95% CI 18.0-94.1), respectively. The median numbers of citations of the SARS articles submitted during the epidemic and over the 2 y thereafter were 17 (interquartile range [IQR] 8.0-52.0) and 8 (IQR 3.2-21.8), respectively, significantly higher than the median numbers of control article citations (15, IQR 8.5-16.5, p<0.05, and 7, IQR 3.0-12.0, p<0.01, respectively).

Conclusions: A majority of the epidemiological articles on SARS were submitted after the epidemic had ended, although the corresponding studies had relevance to public health authorities during the epidemic. To minimize the lag between research and the exigency of public health practice in the future, researchers should consider adopting common, predefined protocols and ready-to-use instruments to improve timeliness, and thus, relevance, in addition to standardizing comparability across studies. To facilitate information dissemination, journal managers should reengineer their fast-track channels, which should be adapted to the purpose of an emerging outbreak, taking into account the requirement of high standards of quality for scientific journals and competition with other online resources.


Conflict of interest statement

The authors have declared that no competing interests exist.

Figures

Figure 1
Figure 1. Distribution of the 311 SARS epidemiology papers in the 11 research domains (see Table 1).
The studies corresponding to the “Case management” and “Investigation and surveillance” categories represented 52% and 23% of the 311 studies, respectively.
Figure 2
Figure 2. Sample sizes used in the epidemiological studies on SARS (152 articles).
“Other” indicates studies in which patients without SARS, households of SARS patients, and quarantined individuals were studied. The sum of n is greater than 152 because several studies analyzed more than one population. Box-plot representation: The horizontal line inside the box represents the median; the lower and upper borders of the box represent the 25th and 75th percentiles, respectively; the whiskers correspond to extending to 1.5 times the box width (i.e., the IQR) from both ends of the box, and the circles represent values outside that interval. Whenever the minimum or maximum observed value is within the whisker interval, the alternative limit of the corresponding whisker becomes the corresponding minimum or maximum observed value.
Figure 3
Figure 3. Publication dates of SARS papers in the 11 research domains (311 articles).
The gray graph on the left shows the timing of the Hong Kong and Canadian epidemics (sum of both daily numbers of SARS cases), with a peak corresponding to 117 and 114 SARS cases on 24 and 25 March 2003. Hong Kong SARS data were from the SARSID database ; Canadian data were from the Public Health Agency of Canada . The vertical line points to 5 July 2003, the date WHO declared that the last human chain of transmission had been broken. Box-plot representation: as in Figure 2 except box representation is horizontal; the colors indicate the study categories (see insert in Figure 1; green, case management; blue, investigation and surveillance; red, psychobehavior; yellow, prevention and control).
Figure 4
Figure 4. Timeline of SARS epidemiology publications on the Hong Kong and Toronto epidemic.
The curves (red, green, and both blue lines) show the cumulative distributions of the 311 articles published by 15 September 2007, according to the publication and acceptance or submission dates for the 185 and 157 articles, respectively, for which the information was available. The solid blue line shows the cumulative distribution of the publication dates, defined as the earliest date of publication, print or online. The dotted blue line shows the cumulative distribution of the print publication dates. The dashed yellow line shows the cumulative distributions of the 29 public health bulletins published by 15 September 2005 according to their publication dates. For comparison, the timing of the Hong Kong and Canadian epidemic is shown in gray on the left, as described in the legend to Figure 3. The vertical line points to 5 July 2003, the date WHO declared that the last human chain of transmission had been broken. The insert is a superposition of the publication timeline and course of the epidemic.
Figure 5
Figure 5. Comparison of publication intervals for case and control articles during and after the SARS epidemic.
Submission, acceptance, and publication dates were available for 129 SARS articles submitted within 2 y (including 33 submitted during the epidemic), but were unavailable for three out of 129 couples of control. The Kaplan-Meier curves show the proportions of submitted manuscripts (ordinate) that took more than x d (abscissa) to be published. The comparisons of the submission-to-acceptance intervals between SARS articles and their control articles are shown for the SARS articles submitted (A) during the epidemic and (B) within 2 y after the end of the SARS epidemic. The comparisons of the acceptance-to-publication intervals between SARS articles and their control articles are shown for the SARS articles submitted (C) during the epidemic and (D) within 2 y after the end of the SARS epidemic.
Figure 6
Figure 6. Journal Impact factors according to the time of publication of the 311 selected articles.
The journal impact factors were obtained for 130 journals in which 299 SARS articles were published, the remaining 12 articles being published in seven journals that were not indexed in the Journal Citation Report database. aUp to and including 5 July 2003, the date WHO declared that the last human chain of transmission had been broken. bBetween 6 July to 31 December 2003. Box-plot representation as described in Figure 2 legend: The horizontal line inside the box represents the median; the lower and upper borders of the box represent the 25th and 75th percentiles, respectively; the whiskers correspond to extending to 1.5 times the box width (i.e., the IQR) from both ends of the box, and the circles represent values outside that interval. Whenever the minimum or maximum observed value is within the whisker interval, the alternative limit of the corresponding whisker becomes the corresponding minimum or maximum observed value.

Comment in

  • Journals, academics, and pandemics.
    PLoS Medicine Editors. PLoS Medicine Editors. PLoS Med. 2010 May 25;7(5):e1000282. doi: 10.1371/journal.pmed.1000282. PLoS Med. 2010. PMID: 20520802 Free PMC article.

Similar articles

Cited by

References

    1. Jones KE, Patel NG, Levy MA, Storeygard A, Balk D, et al. Global trends in emerging infectious diseases. Nature. 2008;451:990–993. - PMC - PubMed
    1. Morens DM, Folkers GK, Fauci AS. The challenge of emerging and re-emerging infectious diseases. Nature. 2004;430:242–249. - PMC - PubMed
    1. Connolly MA. Communicable disease control in emergencies – a field manual. Geneva: World Health Organization. 2005. Available: http://www.who.int/infectious-disease-news/IDdocs/whocds200527/ISBN_9241.... Accessed 16 May 2008.
    1. Heymann DL, Rodier GR. Hot spots in a wired world: WHO surveillance of emerging and re-emerging infectious diseases. Lancet Infect Dis. 2001;1:345–353. - PubMed
    1. Mykhalovskiy E, Weir L. The Global Public Health Intelligence Network and early warning outbreak detection: a Canadian contribution to global public health. Can J Public Health. 2006;97:42–44. - PMC - PubMed

Publication types

MeSH terms