Large scale immune profiling of infected humans and goats reveals differential recognition of Brucella melitensis antigens
- PMID: 20454614
- PMCID: PMC2864264
- DOI: 10.1371/journal.pntd.0000673
Large scale immune profiling of infected humans and goats reveals differential recognition of Brucella melitensis antigens
Abstract
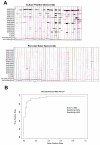
Brucellosis is a widespread zoonotic disease that is also a potential agent of bioterrorism. Current serological assays to diagnose human brucellosis in clinical settings are based on detection of agglutinating anti-LPS antibodies. To better understand the universe of antibody responses that develop after B. melitensis infection, a protein microarray was fabricated containing 1,406 predicted B. melitensis proteins. The array was probed with sera from experimentally infected goats and naturally infected humans from an endemic region in Peru. The assay identified 18 antigens differentially recognized by infected and non-infected goats, and 13 serodiagnostic antigens that differentiate human patients proven to have acute brucellosis from syndromically similar patients. There were 31 cross-reactive antigens in healthy goats and 20 cross-reactive antigens in healthy humans. Only two of the serodiagnostic antigens and eight of the cross-reactive antigens overlap between humans and goats. Based on these results, a nitrocellulose line blot containing the human serodiagnostic antigens was fabricated and applied in a simple assay that validated the accuracy of the protein microarray results in the diagnosis of humans. These data demonstrate that an experimentally infected natural reservoir host produces a fundamentally different immune response than a naturally infected accidental human host.
Conflict of interest statement
PLF is an inventor on patent applications pertaining to this work and owns stock in a company (Anitigen Discovery Inc.) that has licensed the technology. XL is an inventor on patent applications pertaining to this work and is employed at a company (Anitigen Discovery Inc.) that has licensed the technology. WJWM is employed at company (Anitigen Discovery Inc.) that has licensed technology pertaining to this work.
Figures

Similar articles
-
Humoral immune responses of Brucella-infected cattle, sheep, and goats to eight purified recombinant Brucella proteins in an indirect enzyme-linked immunosorbent assay.Clin Diagn Lab Immunol. 1997 Sep;4(5):556-64. doi: 10.1128/cdli.4.5.556-564.1997. Clin Diagn Lab Immunol. 1997. PMID: 9302205 Free PMC article.
-
Characterization of innate immune response to Brucella melitensis infection in goats with permissive or restrictive phenotype for Brucella intramacrophagic growth.Vet Immunol Immunopathol. 2021 Apr;234:110223. doi: 10.1016/j.vetimm.2021.110223. Epub 2021 Mar 8. Vet Immunol Immunopathol. 2021. PMID: 33711712
-
Evaluation of serological tests for diagnosis of Brucella melitensis infection of goats.J Clin Microbiol. 1994 May;32(5):1159-65. doi: 10.1128/jcm.32.5.1159-1165.1994. J Clin Microbiol. 1994. PMID: 8051240 Free PMC article.
-
Control and eradication of Brucella melitensis infection in sheep and goats.Vet Clin North Am Food Anim Pract. 2011 Mar;27(1):95-104. doi: 10.1016/j.cvfa.2010.10.003. Vet Clin North Am Food Anim Pract. 2011. PMID: 21215893 Review.
-
A review of the use of B. melitensis Rev 1 vaccine in adult sheep and goats.Prev Vet Med. 1997 Aug;31(3-4):275-83. doi: 10.1016/s0167-5877(96)01110-5. Prev Vet Med. 1997. PMID: 9234451 Review.
Cited by
-
Immune reactivity of sera obtained from brucellosis patients and vaccinated-rabbits to a fusion protein from Brucella melitensis.Iran J Basic Med Sci. 2015 Apr;18(4):350-5. Iran J Basic Med Sci. 2015. PMID: 26019797 Free PMC article.
-
Brucella melitensis T cell epitope recognition in humans with brucellosis in Peru.Infect Immun. 2014 Jan;82(1):124-31. doi: 10.1128/IAI.00796-13. Epub 2013 Oct 14. Infect Immun. 2014. PMID: 24126518 Free PMC article.
-
Development of ELISAs for diagnosis of acute typhoid fever in Nigerian children.PLoS Negl Trop Dis. 2017 Jun 22;11(6):e0005679. doi: 10.1371/journal.pntd.0005679. eCollection 2017 Jun. PLoS Negl Trop Dis. 2017. PMID: 28640809 Free PMC article.
-
Host-Brucella interactions and the Brucella genome as tools for subunit antigen discovery and immunization against brucellosis.Front Cell Infect Microbiol. 2013 May 16;3:17. doi: 10.3389/fcimb.2013.00017. eCollection 2013. Front Cell Infect Microbiol. 2013. PMID: 23720712 Free PMC article. Review.
-
Protein microarrays and biomarkers of infectious disease.Int J Mol Sci. 2010;11(12):5165-83. doi: 10.3390/ijms11125165. Epub 2010 Dec 16. Int J Mol Sci. 2010. PMID: 21614200 Free PMC article. Review.
References
-
- Pappas G, Akritidis N, Bosilkovski M, Tsianos E. Brucellosis. N Engl J Med. 2005;352:2325–2336. - PubMed
-
- Pappas G, Papadimitriou P, Akritidis N, Christou L, Tsianos EV. The new global map of human brucellosis. Lancet Infect Dis. 2006;6:91–99. - PubMed
-
- Franco MP, Mulder M, Gilman RH, Smits HL. Human brucellosis. Lancet Infect Dis. 2007;7:775–786. - PubMed
-
- Young EJ. An overview of human brucellosis. Clin Infect Dis. 1995;21:283–289; quiz 290. - PubMed
-
- World Organisation for Animal Health. Manual of Diagnostic Tests and Vaccines for Terrestrial Animals; 2009.

