. 2010 May 3;5(5):e10445.
doi: 10.1371/journal.pone.0010445.

Furin targeted drug delivery for treatment of rhabdomyosarcoma in a mouse model

Affiliations

Furin targeted drug delivery for treatment of rhabdomyosarcoma in a mouse model

Katarina Hajdin et al. PLoS One. .

Abstract

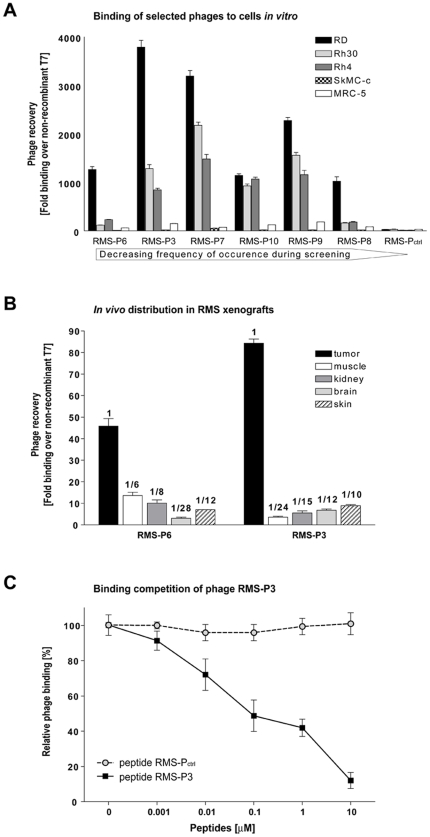
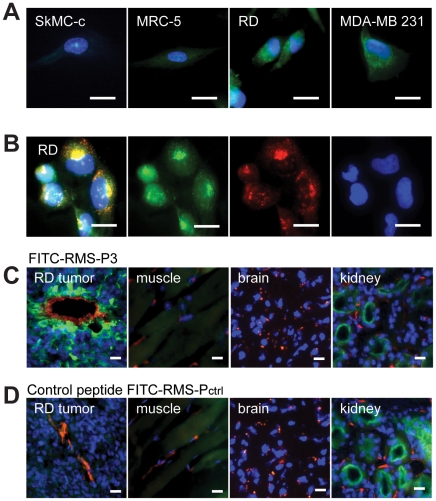
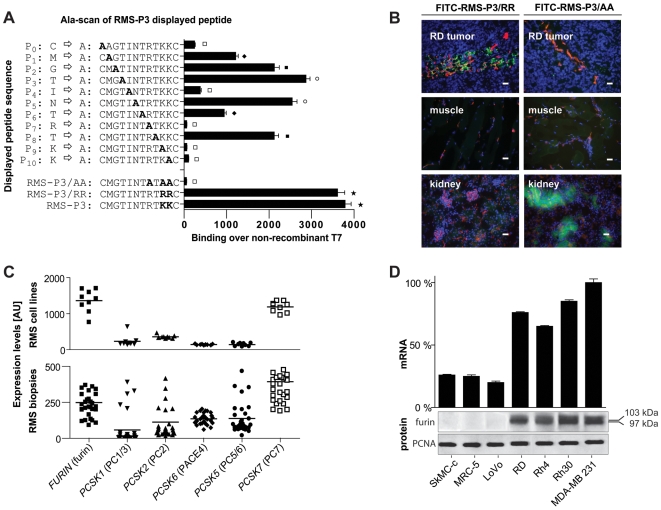
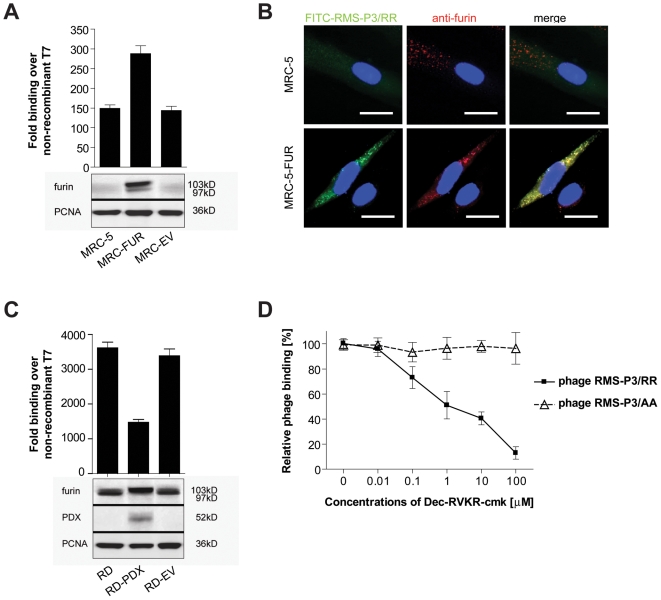
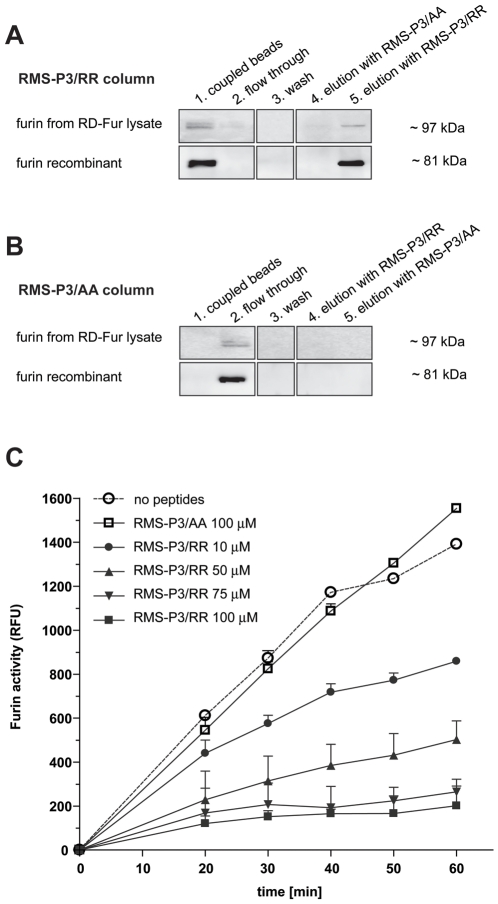
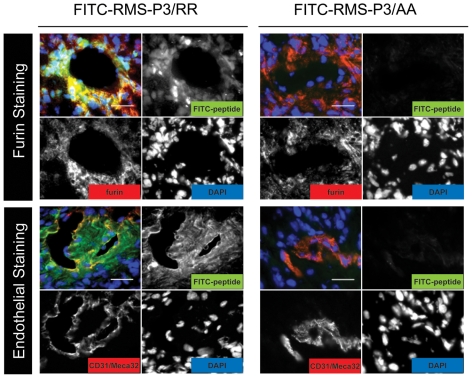
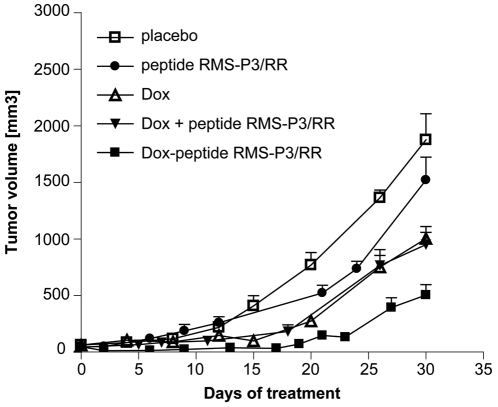
Rhabdomyosarcoma (RMS) is the most common soft tissue sarcoma in children. Improvement of treatment efficacy and decreased side effects through tumor-targeted drug delivery would be desirable. By panning with a phage-displayed cyclic random peptide library we selected a peptide with strong affinity for RMS in vitro and in vivo. The peptide minimal binding motif Arg-X-(Arg/Lys)(Arg/Lys) identified by alanine-scan, suggested the target receptor to be a proprotein convertase (PC). Expression profiling of all PCs in RMS biopsies and cell lines revealed consistent high expression levels for the membrane-bound furin and PC7. Direct binding of RMS-P3 peptide to furin was demonstrated by affinity chromatography and supported by activity and colocalization studies. Treatment of RMS in mice with doxorubicin coupled to the targeting peptide resulted in a two-fold increase in therapeutic efficacy compared to doxorubicin treatment alone. Our findings indicate surface-furin binding as novel mechanism for therapeutic cell penetration which needs to be further investigated. Furthermore, this work demonstrates that specific targeting of membrane-bound furin in tumors is possible for and suggests that RMS and other tumors might benefit from proprotein convertases targeted drug delivery.


Conflict of interest statement

Competing Interests: The authors have declared that no competing interests exist.

Figures

Figure 1
Figure 1. Validation of selected phages binding on RMS cells in vivo and in vitro.
(A) Quantification of binding of single phage clones to different cell lines. Six phages selected from in vitro and in vivo screenings were validated individually in binding assays to three RMS cell lines (embryonal RMS: RD; alveolar RMS: Rh30 and Rh4) as well as to normal myoblasts (SkMC-c) and fibroblast cells (MRC-5). Phage clones are ordered according to the frequency of occurrence. Binding was calculated over non-recombinant T7, depicted are mean values ± SD of three independent experiments. (B) RMS-P3 and RMS-P6 phage distribution in RD mouse xenografts. Homing of phages to tumor was compared to control organs. Binding was normalized over phage T7 and tissue weight. Mean values ± SD of four independent experiments are shown. Numerical values for tumor to organ ratios are indicated above the bars. (C) Validation of RMS-P3 peptide sequence by competition of phage binding. 106 RD cells were incubated for 30 min with increasing concentrations of RMS-P3 peptide (CMGTINTRTKKC) or control peptide (CSPNNTRRPNKC). Then, phages (109 pfu) were added for 1 h. Phage binding was normalized over non-recombinant T7. Data are presented as percentage of maximal phage binding obtained in the absence of synthetic peptide. Error bars indicate mean ± SD from three independent experiments. Binding of phage RMS-P3 decreases significantly with increasing concentrations of synthetic peptide RMP-P3 (least-squares regression, N = 18, r2 = 0.889, b = −17.5, p<0.0001), but not for control peptide (N = 18, r2 = 0.0002, b = 0.055, p = 0.959).
Figure 2
Figure 2. FITC-labeled RMS-P3 binding in vitro and distribution in vivo.
(A) Visualization of FITC-RMS-P3 peptide binding in normal and cancer cells in vitro. Cultured myoblasts (SkMC-c), fibroblasts (MRC-5), RMS cells (RD) and breast carcinoma cells (MDA-MB 231) were incubated with 100 nM FITC-RMS-P3 peptide for 1 h at 37°C. Fluorescence microscopy of fixed cells is shown. (B) Living RD cells were incubated with FITC-RMS-P3 peptide, subsequently fixed and stained with giantin (red). Colocalization is shown in the merged picture by yellow. Blue staining (DAPI) indicates the nuclei. Magnifications: 40x, scale bars: 20 µm. (C) Distribution of FITC-RMS-P3 and control peptide FITC-RMS-Pctrl in mice xenografts of RD cells. FITC-RMS-P3 or control FITC-RMS-Pctrl peptide were injected i.v. and after 10 minutes of circulation, mice were perfused and tumor and control organs were collected. Cryosections were double-labeled with mouse endothelial vessels markers CD31 and MECA-32 (red). Nuclear staining by DAPI is shown in blue. Magnifications: 40x, scale bars: 20 µm.
Figure 3
Figure 3. Identification of the receptor for RMS-P3.
(A) Alanine-scan of the RMS-P3 sequence. RMS-P3 was mutated by replacing each amino acid residue with alanine (codon GCT). All phage mutants were tested individually for binding to RD cells in vitro. Mutated residues are indicated in bold. Phage binding was quantified over non-recombinant T7 and compared to the binding of wild type phage RMS-P3. Depicted are mean values ± SD of three independent experiments. Phage RMS-P3/RR shows no different binding to RD cells than phage RMS-P3, but both are significantly different from all other alanine mutants (One-way ANOVA, with Tukey Karmer HSD test, p<0.05). Bars not connected by same signs are significantly different from each other. (B) FITC-RMS-P3/RR and FITC-RMS-P3/AA distribution in RD xenograft mice. After tail vein injection of both FITC-RMS-P3/RR or control peptide RMS-P3/AA and circulation of 10 min, mice were perfused, tumors and control organs were dissected and FITC-peptide distribution (green) was evaluated in cryosections under fluorescence microscopy. Blood endothelial stainings (CD31 and MECA32) are shown in red, nuclear staining in blue (DAPI). Magnification: 20x, scale bar 50 µm. (C) Expression of proprotein convertases (PCs) measured by microarray profiling of 9 RMS cell lines and 30 RMS biopsy samples. Expression of PCs recognizing the cleavage site R(X)(R/K)(R/K) were considered. Each cell line or biopsy is represented by one data point. (D) Furin expression in different cell lines. Normal myoblasts (SkMC-c), fibroblasts (MRC-5), RMS cell lines (RD, Rh4, Rh30), furin-deficient colorectal carcinoma cells (LoVo) and furin-positive breast carcinoma cells (MBA-MB 231) were tested for furin expression by qRT-PCR (upper graph). SkmC-c and MRC-5 show both significantly lower RNA levels than any tumor cells (One-way ANOVA, Tukey Kramer HSD tests, p<0.05), but similar values to Lovo negative control (not significant). mRNA expression levels are depicted relative to the sample with the highest expression after normalization to GAPDH. Western blot (lower panels). Immature membrane-bound furin was detected at 103 kD, mature furin at 97 kD. PCNA was used as loading control.
Figure 4
Figure 4. RMS-P3/RR phage binding correlates with furin expression levels.
(A) Binding of phage RMS-P3/RR to untransfected (MRC-5), furin-overexpressing (MRC-FUR) and empty vector transfected MRC-5 fibroblasts (MRC-EV) was tested in vitro. Phage binding was quantified over control T7. Results of three independent experiments ± SD are shown. Western blot of the same samples for furin expression and PCNA as loading control (A, lower panels) (B) Micrographs of MRC-5 fibroblasts (upper row) and MRC-5-FUR (lower row) cells incubated with 100 nM FITC-RMS-P3/RR (green) for 1h at RT, fixed and stained with the anti-furin-antibody Mon-152 (red). Nuclei are visualized by DAPI staining (blue). Yellow indicates overlap of the two stainings. Magnification: 40x; scale bars: 20 µm. (C) Inhibition of furin maturation in α1-PDX-transfected RD cells reduces phage binding. Phage RMS-P3/RR binding to untransfected RD, furin-inhibited RD-PDX and empty-vector transfected RD-EV cells was determined over non-recombinant T7 in three independent experiments (means ± SD). Expression of the inhibitor α1-PDX was confirmed by western blotting using 100 µg cell extract with antiserum against α1AT (C, lower panels). (D) Effect of the specific PC-inhibitor Dec-RVKR-cmk on phage RMS-P3/RR binding. Competition was performed with increasing concentrations of Dec-RVKR-cmk and constant amounts of phage (109 pfu). Phage binding was calculated over T7. RMS-P3/RR phage binding decreased with increasing concentrations of Dec-RVKR-cmk (least-squares regression, N = 18, r2 = 0.883, b = −17.9, p<0.0001), but binding of control phage RMS-P3/AA did not.
Figure 5
Figure 5. RMS-P3/RR peptide binds directly to furin and inhibits its activity.
Lysates of RD-FUR cells (approximately 1 mg of total protein, upper rows) or purified recombinant furin (250 ng; lower rows) were loaded on a RMS-P3/RR column (A) or on the control peptide column RMS-P3/AA (B). The columns were washed 10 times to remove unbound furin. The loaded RMS-P3/RR-column was eluted first with control peptide RMS-P3/AA, then with peptide RMS-P3/RR. The RMS-P3/AA column was eluted first with RMS-P3/RR and subsequently cross-eluted with the control peptide RMS-P3/AA. The presence of furin in aliquots from the columns (1) after binding, (2) flow through, (3) last wash, (4) control elution and (5) competitive elution with RMS-P3/RR (in A) and RMS-P2/AA (in B), respectively, was detected by western blotting. (C) Fixed amounts of recombinant furin (3.3U) were incubated with increasing concentrations of RMS-P3/RR peptide or with control peptide (RMS-P3/AA). Furin activity was measured with the fluorogenic substrate Boc-RRVR-AMC at excitation 370 nm/emission 460 nm. The results of three independent experiments ± SD are shown.
Figure 6
Figure 6. FITC-RMS-P3/RR and FITC-RMS-P3/AA distribution in mice bearing RD xenografts.
Peptides were injected i.v. and after circulation the mice were perfused, tumors and control organs were removed and peptide distribution was evaluated on cryosections by fluorescence microscopy. Depicted are overlay images (B, upper left panel) and single channel pictures. FITC-peptide stainings (green), either furin or endothelial stainings (CD31, MECA32) in red and cell nuclei in blue (DAPI) are shown. Magnification: 40x, scale bars 50 µm.
Figure 7
Figure 7. Targeted drug delivery with Dox-RMS-P3/RR in NOD/SCID mice bearing RD xenografts.
Five groups of 6 mice were treated when tumors reached 60 mm3 in size. Treatment consisted of weekly tail vein injections for 30 days. Mice were treated with 10 µg/week of free doxorubicin (), 10 µg doxorubicin equivalent/week of doxorubicin-coupled RMS-P3/RR peptide (▪), with molar equivalent of free peptide RMS-P3/RR (•), 10 µg/week free doxorubicin plus molar equivalent of free peptide RMS-P3/RR (▾) or with vehicle alone (PBS, □). Treatment efficacy was best for Dox-RMS-P3/RR, significantly better than for Dox alone or other treatments. Pairwise student's t-tests on day 30, Dox-RMS-P3/RR vs. Dox alone: p = 0.042, Dox-RMS-P3/RR vs. peptide RMS-P3/RR: p = 0.0004, Dox-RMS-P3/RR vs. placebo: p<0.0001.

Similar articles

Cited by

References

    1. De Giovanni C, Landuzzi L, Nicoletti G, Lollini PL, Nanni P. Molecular and cellular biology of rhabdomyosarcoma. Future Oncol. 2009;5:1449–1475. - PubMed
    1. Breitfeld PP, Meyer WH. Rhabdomyosarcoma: new windows of opportunity. Oncologist. 2005;10:518–527. - PubMed
    1. Adams GP, Weiner LM. Monoclonal antibody therapy of cancer. Nat Biotechnol. 2005;23:1147–1157. - PubMed
    1. Levene AP, Singh G, Palmieri C. Therapeutic monoclonal antibodies in oncology. J R Soc Med. 2005;98:146–152. - PMC - PubMed
    1. Cortez-Retamozo V, Backmann N, Senter PD, Wernery U, De Baetselier P, et al. Efficient cancer therapy with a nanobody-based conjugate. Cancer Res. 2004;64:2853–2857. - PubMed

Publication types

MeSH terms