. 2010 May 3;5(5):e10475.
doi: 10.1371/journal.pone.0010475.

In vivo imaging of single-molecule translocation through nuclear pore complexes by pair correlation functions

Affiliations

In vivo imaging of single-molecule translocation through nuclear pore complexes by pair correlation functions

Francesco Cardarelli et al. PLoS One. .

Abstract

Background: Nuclear pore complexes (NPCs) mediate bidirectional transport of proteins, RNAs, and ribonucleoproteins across the double-membrane nuclear envelope. Although there are many studies that look at the traffic in the nucleus and through the nuclear envelope we propose a method to detect the nucleocytoplasmic transport kinetics in an unperturbed cell, with no requirement for specific labeling of isolated molecules and, most important, in the presence of the cell milieu.

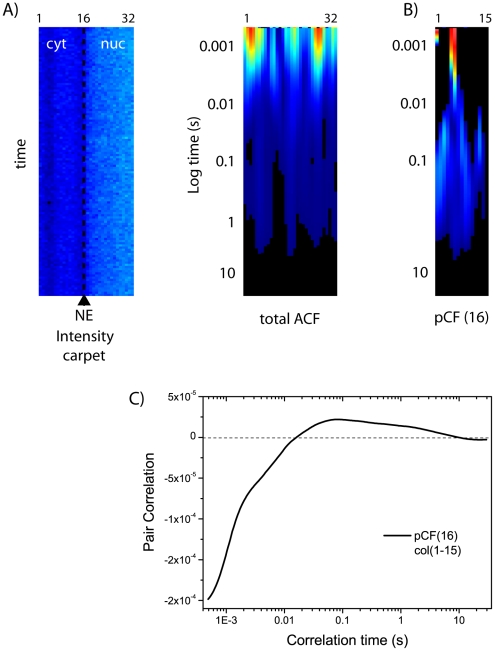
Methodology: The pair correlation function method (pCF) measures the time a molecule takes to migrate from one location to another within the cell in the presence of many molecules of the same kind. The spatial and temporal correlation among two arbitrary points in the cell provides a local map of molecular transport, and also highlights the presence of barriers to diffusion with millisecond time resolution and spatial resolution limited by diffraction. We use the pair correlation method to monitor a model protein substrate undergoing transport through NPCs in living cells, a biological problem in which single particle tracking (SPT) has given results that cannot be confirmed by traditional single-point FCS measurements because of the lack of spatial resolution.

Conclusions: We show that obstacles to molecular flow can be detected and that the pCF algorithm can recognize the heterogeneity of protein intra-compartment diffusion as well as the presence of barriers to transport across NE.


Conflict of interest statement

Competing Interests: The authors have declared that no competing interests exist.

Figures

Figure 1
Figure 1. Overview on the model system used in this study.
(A) The model substrate we studied is composed by a GFP fused to the functional NLS of SV40. (B) NLS-GFP is recognized by specific receptors in the cytoplasm and actively transported into the nucleus (red arrow). Concomitantly, it can passively diffuse across NPCs in both directions (black arrow), as its size (∼28 kDa) is below the cut-off limit of nuclear pores. (C) NLS-GFP intracellular localization upon transient transfection, and under normal growing conditions. Scale bar: 10 µm. (D) Upon energy depletion, NLS-GFP is homogeneously distributed across NE, as cytoplasm-to-nucleus active import is impaired. (E) Magnification of one cell shown in (C), with the NE highlighted by a dotted line.
Figure 2
Figure 2. ACF carpet analysis.
(A) A 3.2 µm-line across NE is scanned left-to-right with a pixel dwell time of 6.3 µs (32 pixels) and a line time of 0.47 ms. Scale bar of the image: 5 µm. (B) Fluorescence intensity is represented as a carpet with the line in the x-direction and the time in the y-direction. (C) The ACF is calculated pixel-by-pixel along the scanned line and represented as a carpet. (D) Two columns extracted from the ACF carpet are displayed, one corresponding to the nucleus (col. 3, in red), the other to the cytoplasm (col. 28, in blue). (E) 3-D-plot of the total ACF carpet.
Figure 3
Figure 3. pCF analysis of intracompartment diffusion.
(A) Schematic representation of intracompartment pCF analysis. (B) ACF and pCF(1, 3, 5) carpets corresponding to an intranuclear segment (columns 1–4). (C) For each carpet shown in (B), the average correlation curve is calculated and displayed in the graph. (D) Image of two neighbor cells with the scanned line (in this case 64 pixels = 6.4 µm) highlighted in red, and the corresponding intensity carpet along that line. Scale bar of the image: 5 µm. (E) pCF(7) analysis highlights the presence of the impenetrable gap between the two cells (approximately at position 45 along the line). The corresponding plot does not yield a maximum of correlation in the gap (even at very long times), while it shows the characteristic positive correlation within each cell. Note that the pCF analysis correctly yields an ‘apparent’ width of the gap that corresponds to the distance selected for the analysis (i.e. 7 pixels = 0.7 µm in Fig. 3D, gap from column 38 to 45 approximately).
Figure 4
Figure 4. pCF analysis of nucleus-to-cytoplasm transport.
(A) Schematic representation of intercompartment pCF analysis: scanning direction is from nucleus to cytoplasm (B) From the total intensity carpet (left panel) we select the nuclear compartment, calculate the ACF (middle panel), and the pCF function at a distance that entirely correlates with the cytoplasm (in this case pCF(12) for columns 3–12, right panel). (C) Average pCF(12) calculated for the carpet in (B). (D) pCF(9) calculated for the whole nuclear compartment. As shown in the graph, pCF(9) yields different average delays depending on the column chosen for analysis.
Figure 5
Figure 5. pCF analysis of cytoplasm-to-nucleus transport.
(A) Schematic representation of intercompartment pCF analysis: scanning direction is from cytoplasm to nucleus. (B) From the total intensity carpet (left panel) we select the cytoplasmic compartment, calculate the ACF (middle panel), and the pCF function at a distance that entirely correlates with the nucleus (in this case pCF(11) for columns 10–18, right panel). (C) Average pCF(11) calculated for the carpet in (B). (D) pCF(11) of two columns extracted from carpet shown in (B).
Figure 6
Figure 6. pCF analysis of cytoplasm-to-nucleus transport under energy-depleting conditions.
(A) Intensity carpet and total ACF analysis for an ATP-depleted cell, with cytoplasm-to-nucleus scanning direction. (B) pCF(16) analysis of the cytoplasmic compartment. (C) Average correlation calculated from the carpet in (B).

Similar articles

Cited by

References

    1. Tran EJ, Wente SR. Dynamic nuclear pore complexes: life on the edge. Cell. 2006;125:1041–1053. - PubMed
    1. Gorlich D, Kutay U. Transport between the cell nucleus and the cytoplasm. Annu Rev Cell Dev Biol. 1999;15:607–660. - PubMed
    1. D'Angelo MA, Hetzer MW. Structure, dynamics and function of nuclear pore complexes. Trends Cell Biol. 2008;18:456–466. - PMC - PubMed
    1. Cronshaw JM, Krutchinsky AN, Zhang W, Chait BT, Matunis MJ. Proteomic analysis of the mammalian nuclear pore complex. J Cell Biol. 2002;158:915–927. - PMC - PubMed
    1. Rout MP, Aitchison JD. The nuclear pore complex as a transport machine. J Biol Chem. 2001;276:16593–16596. - PubMed

Publication types

Substances