. 2010 May 3;5(5):e10422.
doi: 10.1371/journal.pone.0010422.

A differential role for neuropeptides in acute and chronic adaptive responses to alcohol: behavioural and genetic analysis in Caenorhabditis elegans

Affiliations

A differential role for neuropeptides in acute and chronic adaptive responses to alcohol: behavioural and genetic analysis in Caenorhabditis elegans

Philippa Mitchell et al. PLoS One. .

Abstract

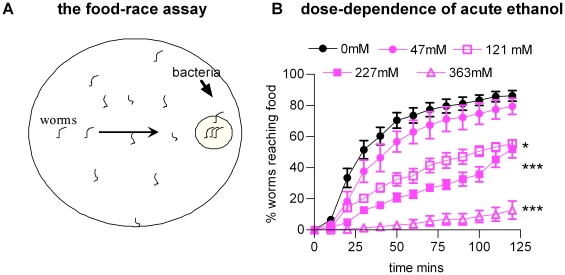
Prolonged alcohol consumption in humans followed by abstinence precipitates a withdrawal syndrome consisting of anxiety, agitation and in severe cases, seizures. Withdrawal is relieved by a low dose of alcohol, a negative reinforcement that contributes to alcohol dependency. This phenomenon of 'withdrawal relief' provides evidence of an ethanol-induced adaptation which resets the balance of signalling in neural circuits. We have used this as a criterion to distinguish between direct and indirect ethanol-induced adaptive behavioural responses in C. elegans with the goal of investigating the genetic basis of ethanol-induced neural plasticity. The paradigm employs a 'food race assay' which tests sensorimotor performance of animals acutely and chronically treated with ethanol. We describe a multifaceted C. elegans 'withdrawal syndrome'. One feature, decrease reversal frequency is not relieved by a low dose of ethanol and most likely results from an indirect adaptation to ethanol caused by inhibition of feeding and a food-deprived behavioural state. However another aspect, an aberrant behaviour consisting of spontaneous deep body bends, did show withdrawal relief and therefore we suggest this is the expression of ethanol-induced plasticity. The potassium channel, slo-1, which is a candidate ethanol effector in C. elegans, is not required for the responses described here. However a mutant deficient in neuropeptides, egl-3, is resistant to withdrawal (although it still exhibits acute responses to ethanol). This dependence on neuropeptides does not involve the NPY-like receptor npr-1, previously implicated in C. elegans ethanol withdrawal. Therefore other neuropeptide pathways mediate this effect. These data resonate with mammalian studies which report involvement of a number of neuropeptides in chronic responses to alcohol including corticotrophin-releasing-factor (CRF), opioids, tachykinins as well as NPY. This suggests an evolutionarily conserved role for neuropeptides in ethanol-induced plasticity and opens the way for a genetic analysis of the effects of alcohol on a simple model system.


Conflict of interest statement

Competing Interests: The authors have declared that no competing interests exist.

Figures

Figure 1
Figure 1. Acute exposure to ethanol impairs performance in a food race assay.
A Diagram to represent the food-race paradigm. Each race was performed for a population of worms (approximately 50 per race) on 9 cm agar plates with a single spot of E. coli 2 cm from the edge of the plate. At time zero, staged worms (L4 plus 1 day) were aliquoted on to the plate diametrically opposite the food source. Every 10 minutes, the number of worms that had reached the food was counted and expressed as a % of the total population. Data are expressed as the mean ± s.e.mean of ‘n’ experiments where each experiment is a single food race. B The effect of performing the race in the presence of ethanol. Ethanol was added to the agar to give an approximate concentration of 50, 100, 250 and 400 mM. Plates were tested for ethanol concentration after use and the average concentration is indicated on the graph. 0 mM (n = 11); 47 mM (n = 4, p>0.05 compared to 0 mM); 100 mM (n = 5; p<0.05 compared to 0 mM); 227 mM (n = 4; p<0.001 compared to 0 mM); 363 mM (n = 4; p<0.001 compared to 0 mM). Statistical analysis was performed using one way ANOVA with Bonferroni multiple comparisons post-test on the last time-points.
Figure 2
Figure 2. Ethanol conditioning induces a withdrawal phenomenon in the food race.
A Diagram showing the conditioning paradigm. Developmentally staged worms were placed on agar plates with an excess of E. coli OP50 and agar containing ethanol. At the end of the conditioning period, the worms were washed from the plates in M9 buffer, washed once more in M9 to remove residual ethanol and E. coli, and then aliquoted onto the food race plate. Three sets of experiments were performed in which either the conditioning time was varied (B), or the conditioning time was set and the recovery time was varied (C), or the conditioning time and recovery time were set and the conditioning concentration of ethanol was varied (D). Parallel controls were performed in which ethanol naive worms raised for similar time-periods were tested for performance in the food race. These indicated no significant effect of the culture time on performance (95±5%, n = 3, reached the food source by the 2 h time-point for L4 plus 1 day worms, and 93±4% for L4 plus 2 days.) B The effect of varying the time-course of ethanol conditioning on performance in the food race. Worms were conditioned on ethanol for the time indicated. 0 h (n = 5); 2 h (n = 6; p>0.05 compared to 0 h); 4 h (n = 4; p>0.05 compared to 0 h); 6 h (n = 7; p<0.001 compared to 0 h); 24 h (n = 6; p<0.001 compared to 0 h); 48 h (n = 4; p<0.001 compared to 0 h). C The effect of varying the recovery time from conditioning on performance in the food race. The recovery times are as indicated. 0 h (n = 6); 2 h (n = 4; p>0.05 compared to 0 h); 4 h (n = 4; p>0.05 compared to 0 h); 8 h (n = 4; p<0.001 compared to 0 h); 16 h (n = 4; p<0.001 compared to 0 h). The experiment was also performed on worms conditioned on ethanol for 48 h which exhibited similar recovery times (see text for details). D The effect of varying the conditioning ethanol concentration on performance in the food race. Worms were conditioned on ethanol for 48 h at the concentration indicated. Each point is the mean of a duplicate determination. Statistical analysis was performed using one way ANOVA with Bonferroni multiple comparisons post-test on the last time-points.
Figure 3
Figure 3. Withdrawal can be relieved by a low dose of ethanol.
A Diagram to show the paradigm used to demonstrate relief from withdrawal. Developmentally staged worms (L4 plus 1 day) were conditioned on abundant food in the presence of 250 mM ethanol for 48 h, recovered from the plates by washing and then tested in the food race either in the absence or presence of ethanol (added to the plates to give an approximate final concentration of 50 mM, mean measured value was 66±2 mM, n>50). B The time-course of the effect of 66±2 mM ethanol on conditioned worms (n = 22; there is a significant effect of ethanol treatment, p<0.001; two way ANOVA). C A comparison for all 4 experimental groups described in A, at the 2 h end time-point of the food race. Each point is the value obtained from a single food race experiment. The bars indicate the mean ± s.e.mean. ‘naive’ have not been pre-exposed to ethanol and are tested in the absence of ethanol; ‘withdrawn’ have been pre-exposed to ethanol and are tested in the absence of ethanol; ‘naive + low eth’ have not been pre-exposed to ethanol and are tested in the presence of a low dose of ethanol; ‘withdrawn + low eth’ have been pre-exposed to ethanol and are tested in the presence of a low dose of ethanol. Statistical analysis was performed using one way ANOVA with Bonferroni multiple comparisons post-test. *** p<0.001. D A comparison of all the paired data sets for conditioned worms tested in the absence (zero) and presence of 66±2 mM ethanol (plus ethanol). The lines connect data from paired groups. 4 out of 22 groups did not show withdrawal relief.
Figure 4
Figure 4. Withdrawal and withdrawal relief can be observed at shorter periods of ethanol conditioning.
Developmentally staged worms (L4 plus 1 day) were conditioned on abundant food in the absence (naive) or presence (withdrawn) of 354±32 mM ethanol for 6 h, recovered from the plates by washing and then tested in the food race either in the absence (naive, withdrawn) or presence (60±1 mM; naive + low eth, withdrawn + low eth) of ethanol. Each point is the mean ± s.e.mean of 4 independent determinations for 50 worms in a food race. Statistical analysis was performed using one way ANOVA with Bonferroni multiple comparisons post-test on the last time-points. ** p<0.01.
Figure 5
Figure 5. The body posture of worms during acute exposure to ethanol and during ethanol withdrawal is different.
The image of the left is a wild-type ethanol naive worm in the absence of ethanol, in the middle is an image of a worm in the presence of 250 mM ethanol, and on the right following exposure to and withdrawal from 250 mM ethanol.
Figure 6
Figure 6. The effect of ethanol on the frequency of reversals.
A In order to quantify the effect of ethanol conditioning on locomotor activity, the conditioning experiments were repeated using the same protocol as shown in Figure 2A except that a 6 h conditioning time was adopted and video recordings were made. Reversals were scored for 5 min for each animal between 5–10 and 40–45 min into the food race. For these and all subsequent figures the same colour code is used to depict each of the different ethanol treatment groups. Statistical analysis was performed using one-way ANOVA with Bonferroni multiple comparisons between the different treatment groups for each time-point. No statistical significance between groups was observed at 40 min. At 5 min statistical differences were observed between all the ethanol naive groups compared to the ethanol withdrawn groups as indicated. Data are presented as mean ± s.e.mean. For the 5 min time-point n = 13 to 15. For the 40 min time-point n = 5 to 15. B Ethanol conditioning did not affect length of reversals. The length of reversal was measured by counting the number of head turns the worm made during the backward movement, where one head turn occurs for one reversal length. Data collected from 5 min recordings of at least 13 worms per condition, taken 5 min after being placed on a food race plate. Note that the proportion of reversals of a given length is not different between naive and conditioned animals, even though the number of reversals is reduced. C. Food deprivation impairs navigational performance and sensitizes worms to ethanol. Wild-type worms (developmentally staged to L4+1 day) were picked onto plates either in the presence or absence of food. Following 6 h they were recovered from the plates by washing in M9 and then tested in a food race with or without the addition of (66±4 mM) ethanol. Statistical significance was tested using one way ANOVA with Bonferroni's multiple comparison post-test on the last time-points (n = 3 to 4). D The effect of food deprivation on reversals. Wild-type worms (developmentally staged to L4+1 day) were conditioned on (231±9 mM) ethanol or incubated in the absence of food for 6 h (±15 min). A control group was also incubated with abundant food for 6 h. Following this, individual worms were recovered by collecting in M9 and transferred to a food race plate. 5 min into the race, worms were video recorded for 5 min for later analysis. Manual analysis of each video was carried out and the number of reversals was counted for each worm. Each data point is a value from one worm and the bars indicate mean ± s.e.mean. Statistical significance was determined with one way ANOVA and Bonferroni's multiple comparison post-test.
Figure 7
Figure 7. Ethanol withdrawal, but not food deprivation, increases the frequency of unaccompanied omega turns.
A The conditioning experiments were repeated using the same protocol as shown in Figure 2A except that a 6 h conditioning time was adopted and video recordings were made. Unaccompanied omega turns were scored for a 5 min period for each animal between 5–10 and 40–45 min into the food race. Statistical analysis was performed using one-way ANOVA with Bonferroni multiple comparisons between the different treatment groups for each time-point. No statistical significance between groups was observed at 40 min. At 5 min statistical differences were observed as indicated. Data are presented as mean ± s.e.mean. For the 5 min time-point n = 13 to 15. For the 40 min time-point n = 5 to 15. * p<0.05, *** p<0.001. B Wild-type worms (developmentally staged to L4+1 day) were conditioned on (231±9 mM) ethanol or incubated in the absence of food for 6 h (*±15 min). A control group (eth naive) was also incubated with abundant food for 6 h. Following this, individual worms were recovered by collecting in M9 and transferred to a food race plate. 5 min into the race, worms were video recorded for 5 min for later analysis. Manual analysis of each video was carried out and the number of omega turns which were not preceded by a reversal was counted for each worm. Each data point is a value from one worm and the bars indicate mean ± s.e.mean. Statistical significance was determined with one way ANOVA and Bonferroni's multiple comparison post-test. *** p<0.001.
Figure 8
Figure 8. The effect of acute and chronic exposure on performance in the food race for the BK channel mutant, slo-1(js379).
The food race assays were performed as described for wild-type worms (described in legend to Figure 1). A The performance of slo-1(js379) worms in the food race in the presence of increasing concentrations of ethanol as indicated. Each point is the mean ± s.e. mean of 4 to 6 determinations. *** p<0.001 one-way ANOVA with Bonferroni multiple comparisons post-test on the last time-points. B Comparison of the effect of acute ethanol (250 mM) on worm locomotory speed for wild-type and slo-1(js379). Speed was measured as described in the legend for Figure 10A. Each data point represents a measurement from a single worm and the bars indicate the mean ± s.e. mean for each data set. *** p<0.001, one way ANOVA with Bonferroni multiple comparisons post-test.
Figure 9
Figure 9. The effect of acute and chronic exposure on performance in the food race for the NPY-like receptor null mutant, npr-1(ky13).
The food race assays were performed as described for wild-type worms (described in legend to Figure 1). A The performance of npr-1(ky13) worms in the food race compared to wild-type. Both groups of worms were ethanol naive and tested in the absence of ethanol. Each point is the mean ± s.e. mean of 3 to 4 determinations. B The effect of ethanol conditioning on npr-1(ky13) compared to wild-type. Worms were conditioned for 48 h on 180 mM ethanol, removed and tested in the food race in the absence or presence of 70 mM ethanol. Each point is the mean ± s.e.mean of 3 to 4 determinations. * p<0.05 using one-way ANOVA with Bonferroni multiple comparisons post-test on the last time-points.
Figure 10
Figure 10. Automated analysis of locomotory behaviour in worms acutely exposed to, or withdrawn from, ethanol confirms distinctive ethanol-induced behavioural states.
A, B and C. Worms were recorded in the food race in different ethanol treatment groups as described in the legend to Figure 6. Three measurements of motility were made from 30 s videos captured after 5 min on the food race plate, using in house software to determine A ‘speed’, B ‘posture measure’ which provides a read out of the bendiness of the worm and C ‘efficiency’ which provides an indication of the translation of the overall movement of the animal into its trajectory. n = 19 to 22 assays of 20 worms per assay. For A, Bonferonni post-tests were performed for all treatment groups compared to naive. For B and C relevant post-tests with significance are indicated. ** p<0.01, *** p<0.001.
Figure 11
Figure 11. A mutant deficient in peptidergic signalling, egl-3 (ok979) exhibits acute but not chronic responses to ethanol.
Data were collected and analysed as described in Figure 10. n = 19 to 20 worms for wild-type and egl-3. Data have been normalised to the ethanol naive state for each strain and are represented as % control. A Speed B Posture measure C Efficiency. There was a significant interaction between genotype and ethanol treatment for all three measurements (speed, F = 9.17, p<0.0001; posture, F = 12.24, p<0.0001; efficiency, F = 13.73, p<0.0001). (Significance shown is between ethanol naive and the ethanol treatment for each genotype; except for posture measure for which the significance shown is between ethanol naive and ethanol withdrawal for wild-type, and ethanol withdrawal and withdrawal relief, also for wild-type, *** p<0.001, * p<0.05).
Figure 12
Figure 12. The ethanol withdrawal phenotype of increased unaccompanied omega turns was rescued by expression of wild-type egl-3 in egl-3(ok979).
The mutants were transformed with cosmid harbouring a wild-type copy of egl-3 behind the native egl-3 promoter. Independent transgenic lines or egl-3 control (transformed with the transformation marker only, Pmyo-2::gfp) were subject to ethanol conditioning (6 h, 250 mM) and assayed for unaccompanied omega turns (as described in Fig 3B). The data points are the value obtained from single worms. n = 10 to 16. Rescue was observed in 4 independent lines.
Figure 13
Figure 13. A model to describe the effects of acute and chronic ethanol on the perfomance of C. elegans in the food race task.

Similar articles

Cited by

References

    1. DSM-IV. Diagnostic and Statistical Manual of Mental Disorders of the American Psychiatric Association. 1994. Washington DC.
    1. Edwards G, Gross MM. Alcohol dependence: provisional description of a clinical syndrome. Br Med J. 1976;1:1058–1061. - PMC - PubMed
    1. Weiss F. Neurocircuitry targets in ethanol reward and dependence. Alcohol Clin Exp Res. 1998;22:3–9. - PubMed
    1. Heinz A, Schäfer M, Higley JD, Krystal JH, Goldman D. Neurobiological correlates of the disposition and maintenance of alcoholism. Pharmacopsychiatry. 2003;Suppl 3:S255–S258. - PubMed
    1. Koob GF, Le Moal M. London: Elsevier Inc; 2006. Alcohol. pp. 173–241. In: Neurobiology of Addiction, Koob GF, Le Moal M.

Publication types

MeSH terms

Substances