

Robustness under functional constraint: the genetic network for temporal expression in Drosophila neurogenesis
- PMID: 20454677
- PMCID: PMC2861627
- DOI: 10.1371/journal.pcbi.1000760
Robustness under functional constraint: the genetic network for temporal expression in Drosophila neurogenesis
Abstract
Precise temporal coordination of gene expression is crucial for many developmental processes. One central question in developmental biology is how such coordinated expression patterns are robustly controlled. During embryonic development of the Drosophila central nervous system, neural stem cells called neuroblasts express a group of genes in a definite order, which leads to the diversity of cell types. We produced all possible regulatory networks of these genes and examined their expression dynamics numerically. From the analysis, we identified requisite regulations and predicted an unknown factor to reproduce known expression profiles caused by loss-of-function or overexpression of the genes in vivo, as well as in the wild type. Following this, we evaluated the stability of the actual Drosophila network for sequential expression. This network shows the highest robustness against parameter variations and gene expression fluctuations among the possible networks that reproduce the expression profiles. We propose a regulatory module composed of three types of regulations that is responsible for precise sequential expression. This study suggests that the Drosophila network for sequential expression has evolved to generate the robust temporal expression for neuronal specification.
Conflict of interest statement
The authors have declared that no competing interests exist.
Figures
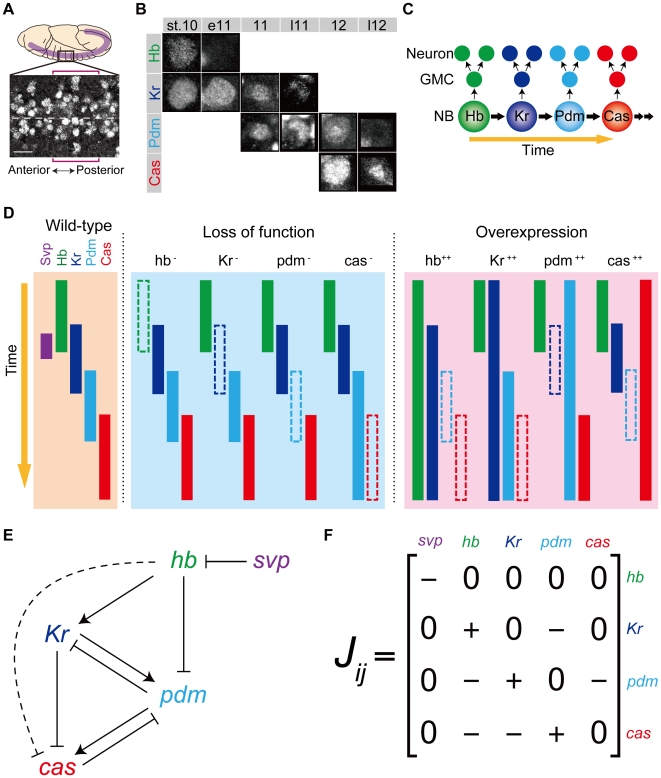
 . (B) The expression levels of Hb, Kr, Pdm, and Cas in a single NB (NB 2–4 lineage) are shown from the developmental stage 10 to 12: early stage 10 (st. 10), early stage 11 (e11), mid stage 11 (11), late stage 11 (l11), mid stage 12 (12), late stage 12 (l12). (C) Schematic representation of the change of the expression pattern in a single NB. (D) The expression profiles of WT, loss-of-function, and overexpression mutants of the genes observed in the experiments (for references, see Table 2). (E) Reconstructed genetic network for sequential expression in Drosophila NBs. Repression from hb to cas (dashed line) was suggested to exist , although there is no direct verification. When the Drosophila network is invoked in this article, this regulation is also included. (F) Matrix representation of the Drosophila network.
 . (A)
. (A)  ; (B)
; (B)  ; and (C)
  .
.

 and {Si} are randomly selected from the following ranges:
  for
for  and
and  for
for  ; and
; and  and
and  . The other parameter values are set as shown in Table 4.
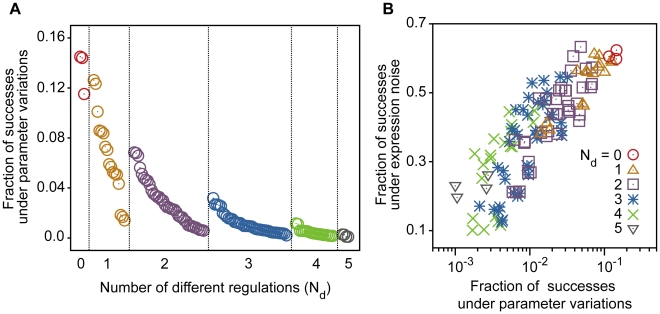
 ,
,  , and
, and  are randomly chosen within the ranges shown in Table 4. The other fixed parameter values are also listed in Table 4. Neglecting the positive self-feedback regulations in the 384 functional networks, 120 networks were chosen and investigated (
Materials and Methods
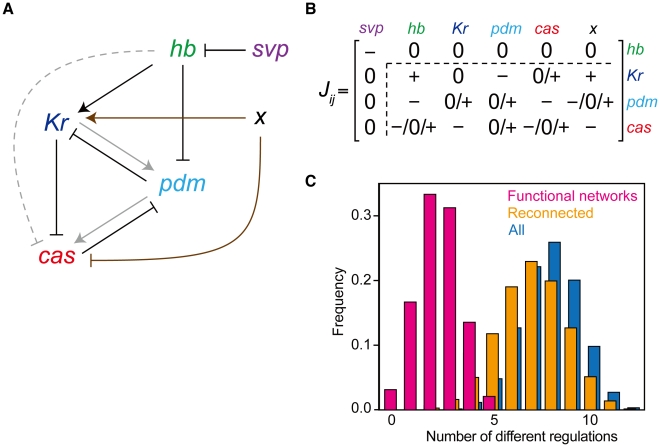
). The dynamics were checked for 50,000 trials in each network. The networks were sorted based on the distance from the Drosophila network (Nd). Here Nd corresponds to the number of regulations different from the Drosophila network. Because there are a few possible regulations from the unknown factor x, more than one network with Nd = 0 exist. (B) The fractions of the trials that reproduce the experimental profile under expression noise (vertical axis) are plotted against the fraction of successes against the random parameter assignments. To analyze the stability against noise, we used 1000 different parameter sets, by which the expression profile is reproduced in the absence of noise for each network. The dynamics were checked for 50 trials for each parameter set.
are randomly chosen within the ranges shown in Table 4. The other fixed parameter values are also listed in Table 4. Neglecting the positive self-feedback regulations in the 384 functional networks, 120 networks were chosen and investigated (
Materials and Methods
). The dynamics were checked for 50,000 trials in each network. The networks were sorted based on the distance from the Drosophila network (Nd). Here Nd corresponds to the number of regulations different from the Drosophila network. Because there are a few possible regulations from the unknown factor x, more than one network with Nd = 0 exist. (B) The fractions of the trials that reproduce the experimental profile under expression noise (vertical axis) are plotted against the fraction of successes against the random parameter assignments. To analyze the stability against noise, we used 1000 different parameter sets, by which the expression profile is reproduced in the absence of noise for each network. The dynamics were checked for 50 trials for each parameter set.

 is shown by normal scale and those of the other parameters are shown by log scale. Each polygon indicates one parameter set. Solid and broken lines indicate mean and s.d. of obtained parameters. The data are drawn from 5,000 trials of the random assignment of parameter values.
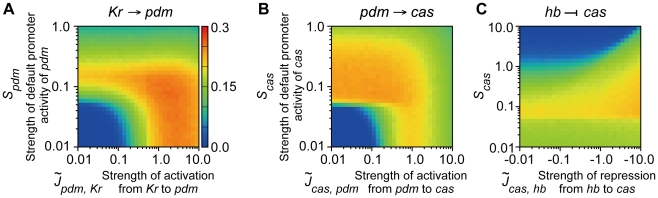
 ,
,  , and
, and  ) and default promoter activities (Spdm and Scas). Dependencies of robustness to (A)
  (strength of activation from Kr to pdm) and Spdm, (B)
  (strength of activation from pdm to cas) and Scas, and (C)
  (strength of the repression from hb to cas) and Scas. The other parameters are set as listed in Table 4. The temporal dynamics were tested for 50,000 trials.
Similar articles
-
Gene regulatory networks in Drosophila early embryonic development as a model for the study of the temporal identity of neuroblasts.Biosystems. 2020 Nov;197:104192. doi: 10.1016/j.biosystems.2020.104192. Epub 2020 Jun 30. Biosystems. 2020. PMID: 32619531
-
Cutting edge technologies expose the temporal regulation of neurogenesis in the Drosophila nervous system.Fly (Austin). 2022 Dec;16(1):222-232. doi: 10.1080/19336934.2022.2073158. Fly (Austin). 2022. PMID: 35549651 Free PMC article. Review.
-
cis-regulatory analysis of the Drosophila pdm locus reveals a diversity of neural enhancers.BMC Genomics. 2015 Sep 16;16(1):700. doi: 10.1186/s12864-015-1897-2. BMC Genomics. 2015. PMID: 26377945 Free PMC article.
-
Segment polarity genes in neuroblast formation and identity specification during Drosophila neurogenesis.Bioessays. 1999 Jun;21(6):472-85. doi: 10.1002/(SICI)1521-1878(199906)21:6<472::AID-BIES4>3.0.CO;2-W. Bioessays. 1999. PMID: 10402954 Review.
-
Transcriptional dynamics of microRNAs and their targets during Drosophila neurogenesis.RNA Biol. 2019 Jan;16(1):69-81. doi: 10.1080/15476286.2018.1558907. Epub 2019 Jan 20. RNA Biol. 2019. PMID: 30582411 Free PMC article.
Cited by
-
A checkpoints capturing timing-robust Boolean model of the budding yeast cell cycle regulatory network.BMC Syst Biol. 2012 Sep 28;6:129. doi: 10.1186/1752-0509-6-129. BMC Syst Biol. 2012. PMID: 23017186 Free PMC article.
-
Spatiotemporal network motif reveals the biological traits of developmental gene regulatory networks in Drosophila melanogaster.BMC Syst Biol. 2012 May 1;6:31. doi: 10.1186/1752-0509-6-31. BMC Syst Biol. 2012. PMID: 22548745 Free PMC article.
-
The neuroblast timer gene nubbin exhibits functional redundancy with gap genes to regulate segment identity in Tribolium.Development. 2021 Aug 15;148(16):dev199719. doi: 10.1242/dev.199719. Epub 2021 Aug 20. Development. 2021. PMID: 34351412 Free PMC article.
-
A Boolean model of the gene regulatory network underlying Mammalian cortical area development.PLoS Comput Biol. 2010 Sep 16;6(9):e1000936. doi: 10.1371/journal.pcbi.1000936. PLoS Comput Biol. 2010. PMID: 20862356 Free PMC article.
-
Mutational analysis of a Drosophila neuroblast enhancer governing nubbin expression during CNS development.Genesis. 2018 Aug;56(8):e23237. doi: 10.1002/dvg.23237. Epub 2018 Aug 18. Genesis. 2018. PMID: 30005136 Free PMC article.
References
-
- Alon U. An introduction to systems biology: design principles of biological circuits: Chapman & Hall. 2006
-
- Wagner A. Robustness and evolvability in living systems: Princeton University Press. 2005
Publication types
MeSH terms
LinkOut - more resources
Full Text Sources
Molecular Biology Databases
