

Multivariate autoregressive modeling and granger causality analysis of multiple spike trains
- PMID: 20454705
- PMCID: PMC2862319
- DOI: 10.1155/2010/752428
Multivariate autoregressive modeling and granger causality analysis of multiple spike trains
Abstract
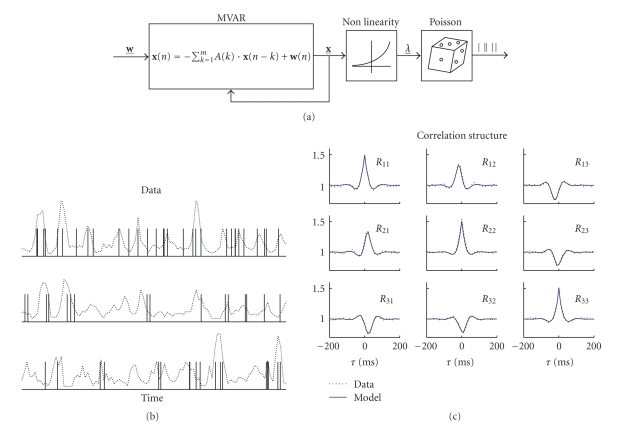
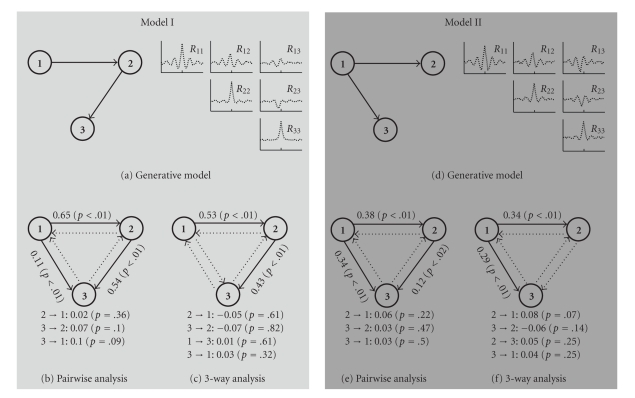
Recent years have seen the emergence of microelectrode arrays and optical methods allowing simultaneous recording of spiking activity from populations of neurons in various parts of the nervous system. The analysis of multiple neural spike train data could benefit significantly from existing methods for multivariate time-series analysis which have proven to be very powerful in the modeling and analysis of continuous neural signals like EEG signals. However, those methods have not generally been well adapted to point processes. Here, we use our recent results on correlation distortions in multivariate Linear-Nonlinear-Poisson spiking neuron models to derive generalized Yule-Walker-type equations for fitting ''hidden" Multivariate Autoregressive models. We use this new framework to perform Granger causality analysis in order to extract the directed information flow pattern in networks of simulated spiking neurons. We discuss the relative merits and limitations of the new method.
Figures
Similar articles
-
Analyzing multiple spike trains with nonparametric Granger causality.J Comput Neurosci. 2009 Aug;27(1):55-64. doi: 10.1007/s10827-008-0126-2. Epub 2009 Jan 10. J Comput Neurosci. 2009. PMID: 19137420
-
Generation of spatiotemporally correlated spike trains and local field potentials using a multivariate autoregressive process.J Neurophysiol. 2010 May;103(5):2912-30. doi: 10.1152/jn.00518.2009. Epub 2009 Dec 23. J Neurophysiol. 2010. PMID: 20032244
-
Assessing directed information as a method for inferring functional connectivity in neural ensembles.Annu Int Conf IEEE Eng Med Biol Soc. 2011;2011:7324-7. doi: 10.1109/IEMBS.2011.6091708. Annu Int Conf IEEE Eng Med Biol Soc. 2011. PMID: 22256030
-
Linear and nonlinear causality between signals: methods, examples and neurophysiological applications.Biol Cybern. 2006 Oct;95(4):349-69. doi: 10.1007/s00422-006-0098-0. Epub 2006 Aug 23. Biol Cybern. 2006. PMID: 16927098 Review.
-
Nonlinear multivariate analysis of neurophysiological signals.Prog Neurobiol. 2005 Sep-Oct;77(1-2):1-37. doi: 10.1016/j.pneurobio.2005.10.003. Epub 2005 Nov 14. Prog Neurobiol. 2005. PMID: 16289760 Review.
Cited by
-
Granger causality-based synaptic weights estimation for analyzing neuronal networks.J Comput Neurosci. 2015 Jun;38(3):483-97. doi: 10.1007/s10827-015-0550-z. Epub 2015 Mar 13. J Comput Neurosci. 2015. PMID: 25761744
-
Using multivariate cross correlations, Granger causality and graphical models to quantify spatiotemporal synchronization and causality between pest populations.BMC Ecol. 2016 Aug 5;16:33. doi: 10.1186/s12898-016-0087-7. BMC Ecol. 2016. PMID: 27495149 Free PMC article.
-
Intracranial Directed Connectivity Links Subregions of the Prefrontal Cortex to Major Depression.medRxiv [Preprint]. 2024 Aug 8:2024.08.07.24311546. doi: 10.1101/2024.08.07.24311546. medRxiv. 2024. Update in: Nat Commun. 2025 Jul 9;16(1):6309. doi: 10.1038/s41467-025-61487-6. PMID: 39148826 Free PMC article. Updated. Preprint.
-
Intracranial directed connectivity links subregions of the prefrontal cortex to major depression.Nat Commun. 2025 Jul 9;16(1):6309. doi: 10.1038/s41467-025-61487-6. Nat Commun. 2025. PMID: 40628743 Free PMC article.
-
Copula regression analysis of simultaneously recorded frontal eye field and inferotemporal spiking activity during object-based working memory.J Neurosci. 2015 Jun 10;35(23):8745-57. doi: 10.1523/JNEUROSCI.5041-14.2015. J Neurosci. 2015. PMID: 26063909 Free PMC article.
References
-
- Brown EN, Kass RE, Mitra PP. Multiple neural spike train data analysis: state-of-the-art and future challenges. Nature Neuroscience. 2004;7(5):456–461. - PubMed
-
- Göbel W, Helmchen F. In vivo calcium imaging of neural network function. Physiology. 2007;22(6):358–365. - PubMed
-
- Shoham S, O’Connor DH, Sarkisov DV, Wang SS-H. Rapid neurotransmitter uncaging in spatially defined patterns. Nature Methods. 2005;2(11):837–843. - PubMed
-
- Granger CWJ. Investigating causal relations by econometric models and cross-spectral methods. Econometrica. 1969;37(3):424–438.
Publication types
MeSH terms
Grants and funding
LinkOut - more resources
Full Text Sources
