. 2010 Jun 14;12(22):5911-9.
doi: 10.1039/c003661g. Epub 2010 May 8.

Dynamic nuclear polarization-enhanced solid-state NMR spectroscopy of GNNQQNY nanocrystals and amyloid fibrils

Affiliations

Dynamic nuclear polarization-enhanced solid-state NMR spectroscopy of GNNQQNY nanocrystals and amyloid fibrils

Galia T Debelouchina et al. Phys Chem Chem Phys. .

Abstract

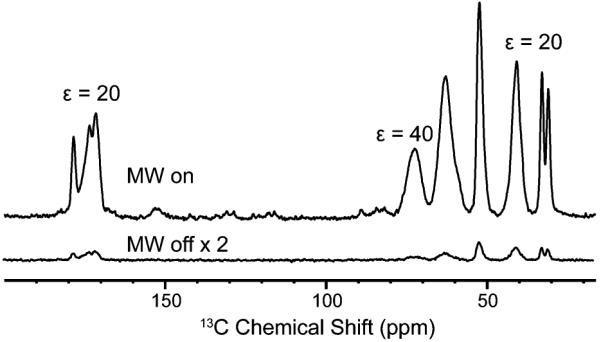
Dynamic nuclear polarization (DNP) utilizes the inherently larger polarization of electrons to enhance the sensitivity of conventional solid-state NMR experiments at low temperature. Recent advances in instrumentation development and sample preparation have transformed this field and have opened up new opportunities for its application to biological systems. Here, we present DNP-enhanced (13)C-(13)C and (15)N-(13)C correlation experiments on GNNQQNY nanocrystals and amyloid fibrils acquired at 9.4 T and 100 K and demonstrate that DNP can be used to obtain assignments and site-specific structural information very efficiently. We investigate the influence of temperature on the resolution, molecular conformation, structural integrity and dynamics in these two systems. In addition, we assess the low-temperature performance of two commonly used solid-state NMR experiments, proton-driven spin diffusion (PDSD) and transferred echo double resonance (TEDOR), and discuss their potential as tools for measurement of structurally relevant distances at low temperature in combination with DNP.


Figures

Fig. 1
Fig. 1
13C CP spectra of [U–13C,15N GNNQ]QNY monoclinic crystals recorded with (top) and without (bottom) DNP. The enhancement for the signals arising from the crystals is ~20, while the enhancement for the glycerol peaks is ~40. The MW irradiation time is 6 s for both spectra.
Fig. 2
Fig. 2
DNP-enhanced 13C–13C PDSD correlation spectrum of [U–13C,15N GNNQ]QNY monoclinic crystals obtained at 9.4 T, 105 K, ωr/2σ = 9 kHz, and τmix = 5 ms.
Fig. 3
Fig. 3
DNP-enhanced TEDOR spectra of [U–13C,15N GNNQ]QNY monoclinic crystals obtained at 9.4 T, 105 K, ωr/2σ =9 kHz, and τmix = 1.8 ms (top), and 3.6 ms (bottom). Two intermolecular contacts are observed at τmix = 3.6 ms.
Fig. 4
Fig. 4
Crystal lattice of monoclinic GNNQQNY (PDB ID 1YJP). Several possible intra- and intermolecular contacts between Q10 NE and the CA atoms of other labeled residues are indicated. The image was produced using the Chimera software.
Fig. 5
Fig. 5
(a) 13C CP spectra of GNN[U–13C,15N QQN]Y fibrils obtained with DNP (top) and without DNP (bottom) at 400 MHz, ωr/2σ = 9 kHz, 100 K, 16 scans, and MW irradiation time of 6.5 s. The enhancement for the fibrils and the glycerol peaks is 35. (b) 13C CP spectrum obtained with the same sample after the DNP experiments were performed. Spectrum was recorded at 750 MHz. (c) 13C CP spectrum of fibrils prepared without radical and glycerol, recorded at 700 MHz. Experimental parameters for (b) and (c) are ωr/2σ = 9 kHz, 300 K, 128 scans, and scan delay of 3 s. Asterisks denote side bands.
Fig. 6
Fig. 6
13C–13C correlations of GNN[U–13C,15N QQN]Y fibrils collected at (a) 750 MHz without DNP, PDSD τmix = 10 ms, ωr/2σ = 9 kHz, 300 K, and (b) 400 MHz with DNP, PDSD τmix = 5 ms, ωr/2σ = 9 kHz, 100 K. The asterisks in (a) denote side bands.
Fig. 7
Fig. 7
15N–13C correlation experiments of GNN[U–13C,15N QQN]Y fibrils recorded with TEDOR mixing. (a) Spectrum recorded at 750 MHz, ωr/2σ = 9 kHz, 300 K and τmix = 1.8 ms. (b) and (c) Spectra recorded with DNP at 400 MHz, ωr/2σ = 9 kHz, 100 K and τmix = 1.8 ms and 3.6 ms respectively.
Fig. 8
Fig. 8
1D TEDOR build-up curves of GNN[U–13C,15N QQN]Y fibrils obtained at (a) 400 MHz, 100 K with DNP and (b) 750 MHz, 300 K, without DNP.
Fig. 9
Fig. 9
Comparison of the 13C and 15N chemical shifts obtained at 100 K with DNP and 298 K without DNP for [U–13C,15N GNNQ]QNY monoclinic crystals (top) and GNN[U–13C,15N QQN]Y fibrils (bottom).

Similar articles

Cited by

References

    1. Maly T, Debelouchina GT, Bajaj VS, Hu K-N, Joo C-G, Mak-Jurkauskas ML, Sirigiri JR, van der Wel PCA, Herzfeld J, Temkin RJ, Griffin RG. J. Chem. Phys. 2008;128:052211. - PMC - PubMed
    1. Barnes AB, De Paepe G, van der Wel PCA, Hu KN, Joo CG, Bajaj VS, Mak-Jurkauskas ML, Sirigiri JR, Herzfeld J, Temkin RJ, Griffin RG. Appl. Magn. Reson. 2008;34:237. - PMC - PubMed
    1. Hu KN, Song C, Yu H, Swager TM, Griffin RG. J. Chem. Phys. 2008;128:052302. - PubMed
    1. Song C, Hu KN, Joo CG, Swager TM, Griffin RG. J. Am. Chem. Soc. 2006;128:11385. - PubMed
    1. Kessenikh AV, Manenkov AA, Pyatnitskii GI. Phys. Solid State. 1964;6:641.

Publication types