. 2010 Jun 14;11(9):1273-9.
doi: 10.1002/cbic.201000125.

Multivalent display and receptor-mediated endocytosis of transferrin on virus-like particles

Affiliations

Multivalent display and receptor-mediated endocytosis of transferrin on virus-like particles

Deboshri Banerjee et al. Chembiochem. .

Abstract

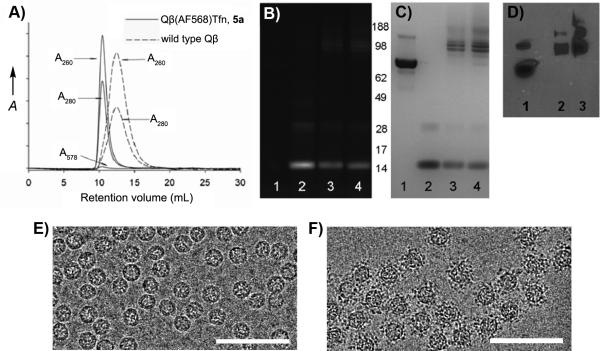
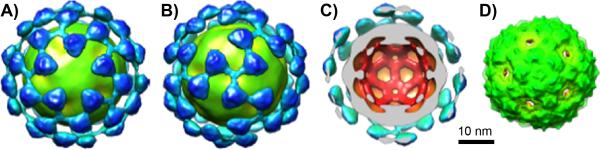
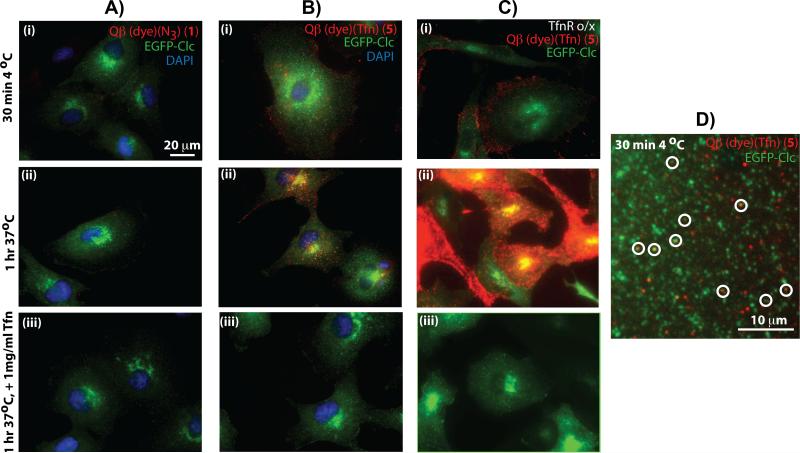
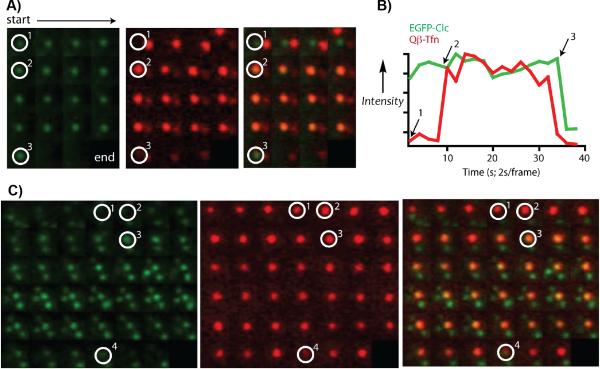
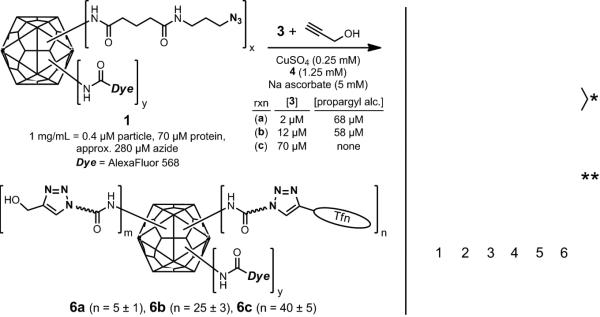
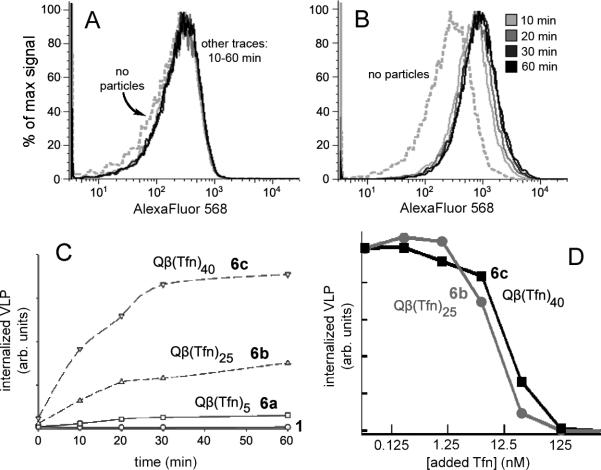
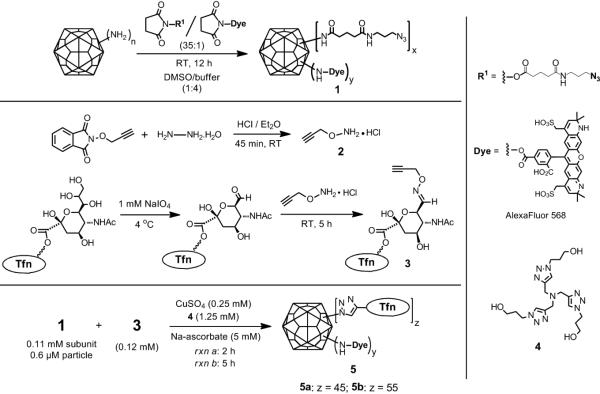
The structurally regular and stable self-assembled capsids derived from viruses can be used as scaffolds for the display of multiple copies of cell- and tissue-targeting molecules and therapeutic agents in a convenient and well-defined manner. The human iron-transfer protein transferrin, a high affinity ligand for receptors upregulated in a variety of cancers, has been arrayed on the exterior surface of the protein capsid of bacteriophage Qbeta. Selective oxidation of the sialic acid residues on the glycan chains of transferrin was followed by introduction of a terminal alkyne functionality through an oxime linkage. Attachment of the protein to azide-functionalized Qbeta capsid particles in an orientation allowing access to the receptor binding site was accomplished by the Cu(I)-catalyzed azide-alkyne cycloaddition (CuAAC) click reaction. Transferrin conjugation to Qbeta particles allowed specific recognition by transferrin receptors and cellular internalization through clathrin-mediated endocytosis, as determined by fluorescence microscopy on cells expressing GFP-labeled clathrin light chains. By testing Qbeta particles bearing different numbers of transferrin molecules, it was demonstrated that cellular uptake was proportional to ligand density, but that internalization was inhibited by equivalent concentrations of free transferrin. These results suggest that cell targeting with transferrin can be improved by local concentration (avidity) effects.


Figures

Figure 1
Figure 1
Characterization of Qβ-Tfn conjugates. (A) Size-exclusion FPLC (Superose-6 column). (B) SDS-PAGE analysis of the protein gel under UV illumination and (C) after SimplyBlue staining. For (B) and (C), lanes: (1) transferrin, (2) Qβ-azide/dye conjugate 1, (3) Qβ-Tfn conjugate 5a (45 Tfn/particle), (4) Qβ-Tfn conjugate 5b (55 Tfn/particle). (D) Western blot analysis, probing with anti-transferrin antibody; lanes: (1) transferrin, (2) 5a, (3) 5b. (E) TEM of underivatized Qβ. (F) TEM of Qβ-Tfn conjugate 5b. Scale bar = 100 nm.
Figure 2
Figure 2
Cryo-electron microscopy image reconstructions at 17.4 Å resolution. (A,B) Qβ(mCherry)(Tfn)55 conjugate; views down the 5- and 3-fold symmetry axes, respectively. (C) Cross-sectional view showing added density other than that of the VLP in light blue. (D) Wild-type Qβ and Qb(mCherry).
Figure 3
Figure 3
Representative epi-fluorescence microscopy images showing binding and internalization of VLP particles in EGFP-Clc BSC1 cells. (Column A) Qβ particle 1 with EGFP-Clc BSC1 cells. (Column B) Qβ-Tfn conjugate 5b with EGFP-Clc BSC1 cells. (Column C) 5b and EGFP-Clc BSC1 cells overexpressing transferrin receptors. (Row i) After incubation at 4°C for 30 min. (Row ii) Preincubated at 4°C followed by shift to 37°C for 60 min. (Row iii) As in Row ii, except in the presence of excess free Tfn (1 mg/mL). (D) High-magnification image showing punctate red (5b), green (EGFP-Clc), and colocalized (circled) VLPs with CCPs on the surface of a BSC1 cell after 30 minutes at 4°C. Very similar images were observed with cells incubated at 37°C for 5 min (Supporting Information). In all experiments, VLP concentration was 1.2 μg/mL (0.47 nM in particles).
Figure 4
Figure 4
Live cell TIRF images showing green (EGFP-Clc), red (Qβ-Tfn particle 5b), and merged channels of an approximately 2 μm2 area of the bottom surface of a BSC1 cell. Images go left-to-right across each row, and from top to bottom, taken at 2-second intervals with the green channel preceding the red channel. (A) VLPs associating with a pre-existing coated pit (circled white), followed by internalization of the complex as a whole. Position 1 shows the pre-existing coated pit. Position 2 marks the initial recruitment of the VLP. Position 3 is the time point at which internalization occurs between the acquisition of the green and red channels; note that both are gone at the next time point. (B) Plot of intensity profiles of the CCP (green) and VLP (red) at the indicated spot in (A), normalized each to their respective maximum intensity. (C) VLP nucleating a CCP. Position 1 shows a bound VLP but no clathrin signal. At positions marked 2, the CCP is beginning to assemble at the VLP. By position 3, the pit is fully formed, and it is internalized at position 4. In this case the internalized VLP remains close to the plasma membrane, while the clathrin coat disassembles.
Figure 5
Figure 5
(Left) Synthesis of particles with varying loadings of attached transferrin. (Right) Coomassie stained protein gel of transferrin (lane 2), Qβ-azide 1 (lane 3), Qβ-Tfn conjugates 6a (lane 4), 6b (lane 5), and 6c (lane 6). (Standard protein molecular weight markers appear in lane 1). The bands labeled with a single asterisk denote linked transferrin-Qβ linkages with differing numbers of Qβ coat protein attached to each transferrin molecule. Bands marked with a double asterisk are due to Qβ capsid protein dimers that remain noncovalently associated even under the denaturing conditions of the analysis.
Figure 6
Figure 6
FACS analysis following incubation of Qβ-Tfn conjugates with BSC1 cells at 37°C for the specified time, followed by washing and chemical fixation. (A) Underivatized Qβ VLP 1 (3 μg/mL, 1.2 nM in particles), showing no evidence of binding. (B) Qβ-Tfn VLP 6c (1.6 μg/mL (0.6 nM in particle), showing significant and rapid virus uptake. (C) Summary of data for 1 and 6a-c, showing that higher Tfn load leads to increased uptake by cells. (D) Effect of increasing concentrations of free unlabeled Tfn on cellular uptake of 1.6 μg/mL 6b (i.e. 0.6 nM particle, 15 nM Tfn) or 6c (24 nM Tfn) as detected by FACS.
Scheme 1
Scheme 1
Synthesis of Qβ-Tfn conjugates.

References

    1. Huebers HA, Finch CA. Physiol. Rev. 1987;67:520. - PubMed
    1. Anderson GJ, Vulpe CD. Cell. Mol. Life Sci. 2009;66:3241. - PMC - PubMed
    1. Ryschich E, Huszty G, Knaebel HP, Hartel M, Buechler MW, Schmidt J. Eur. J. Cancer. 2004;40:1418. - PubMed
    1. Daniels TR, Delgado T, Helguera G, Penichet ML. Clinical Immunology. 2006;121:159. - PubMed
    2. Daniels TR, Delgado T, Rodriguez JA, Helguera G, Penichet ML. Clinical Immunology. 2006;121:144. - PubMed
    1. Li H, Qian ZM. Med. Res. Rev. 2002;22:225. - PubMed
    2. Li H, Sun H, Qian ZM. Trends Pharmacol. Sci. 2002;23:206. - PubMed
    3. Qian ZM, Li H, Sun H, Ho K. Pharmacol. Rev. 2002;54:561. - PubMed
    4. Widera A, Norouziyan F, Shen WC. Adv. Drug Delivery Rev. 2003;55:1439. - PubMed

Publication types

LinkOut - more resources