

Extended storage of platelet-rich plasma-prepared platelet concentrates in plasma or Plasmalyte
- PMID: 20456703
- PMCID: PMC2970715
- DOI: 10.1111/j.1537-2995.2010.02669.x
Extended storage of platelet-rich plasma-prepared platelet concentrates in plasma or Plasmalyte
Abstract
Background: Using bacterial detection or pathogen reduction, extended platelet (PLT) storage may be licensed if PLT viability is maintained. The Food and Drug Administration (FDA)'s poststorage PLT acceptance guidelines are that autologous stored PLT recoveries and survivals should be 66 and 58% or greater, respectively, of each donor's fresh PLT data.
Study design and methods: Nonleukoreduced PLT concentrates were prepared from whole blood donations. Autologous PLT concentrates from 62 subjects were stored in 100% plasma (n=44) or 20% plasma/80% Plasmalyte (n=18), an acetate-based, non-glucose-containing crystalloid solution previously used for PLT storage. Fresh PLTs were obtained on the day the donor's stored PLTs were to be transfused. The fresh and stored PLTs were alternately radiolabeled with either (51) chromium or (111) indium, and in vitro measurements were performed on the stored PLTs.
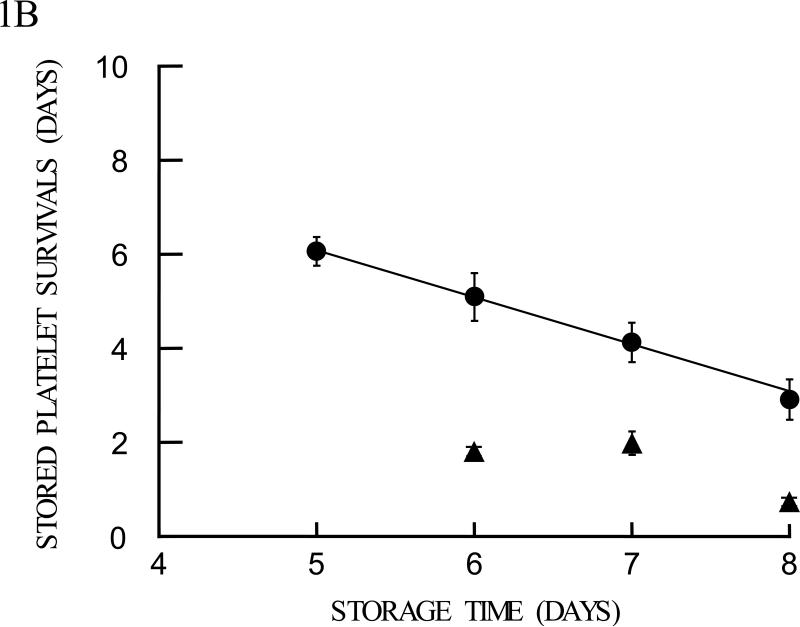
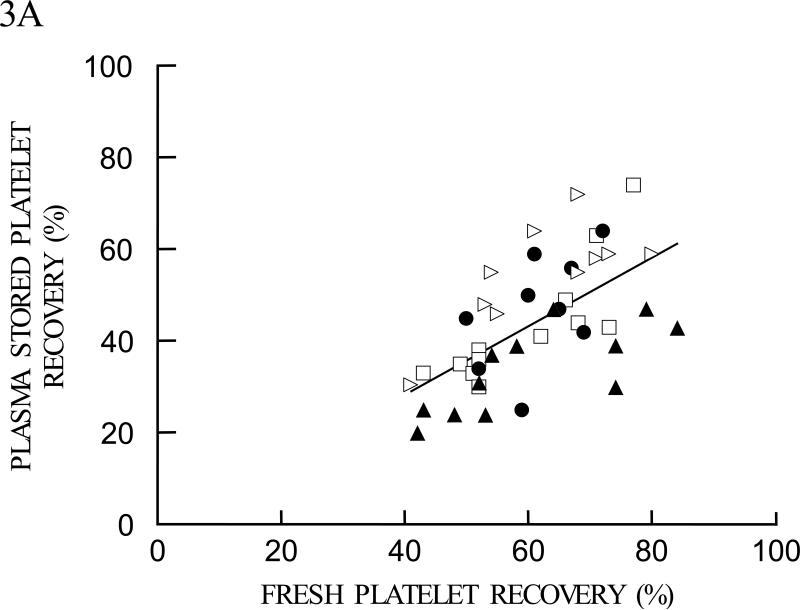
Results: The FDA's PLT recovery criteria were met for 7 days of plasma storage, but PLT survivals maintained viability for only 6 days. Plasmalyte-stored PLTs did not meet either acceptance criteria after 6 days of storage. After 7 days of storage, PLT recoveries averaged 43±4 and 30±4% and survivals 4.1±0.4 and 2.0±0.2 days for plasma- and Plasmalyte-stored PLTs, respectively (p=0.03 for recoveries and p<0.001 for survivals). Poststorage PLT recoveries correlated with the commonly used in vitro PLT quality measurements of hypotonic shock response and annexin V binding, while survivals correlated with extent of shape change, morphology score, and pH.
Conclusion: There is a progressive decrease in recoveries and survivals of plasma-stored PLTs over time. PLT viability is better maintained in plasma than Plasmalyte.
© 2010 American Association of Blood Banks.
Figures


Similar articles
-
Extended storage of buffy coat platelet concentrates in plasma or a platelet additive solution.Transfusion. 2014 Sep;54(9):2283-91. doi: 10.1111/trf.12634. Epub 2014 Mar 28. Transfusion. 2014. PMID: 24673482 Free PMC article.
-
Platelet concentrates prepared after a 20- to 24-hour hold of the whole blood at 22°C.Transfusion. 2012 Sep;52(9):2043-8. doi: 10.1111/j.1537-2995.2011.03546.x. Epub 2012 Feb 10. Transfusion. 2012. PMID: 22320682 Free PMC article.
-
A randomized controlled trial comparing autologous radiolabeled in vivo platelet (PLT) recoveries and survivals of 7-day-stored PLT-rich plasma and buffy coat PLTs from the same subjects.Transfusion. 2011 Jun;51(6):1241-8. doi: 10.1111/j.1537-2995.2010.03007.x. Epub 2011 Jan 7. Transfusion. 2011. PMID: 21214584 Clinical Trial.
-
Platelets stored in whole blood at 4°C: in vivo posttransfusion platelet recoveries and survivals and in vitro hemostatic function.Transfusion. 2019 Jun;59(6):2084-2092. doi: 10.1111/trf.15302. Epub 2019 Apr 12. Transfusion. 2019. PMID: 30977914
-
Platelet Dynamics in Neurodegenerative Disorders: Investigating the Role of Platelets in Neurological Pathology.J Clin Med. 2024 Apr 3;13(7):2102. doi: 10.3390/jcm13072102. J Clin Med. 2024. PMID: 38610867 Free PMC article. Review.
Cited by
-
Extended storage of buffy coat platelet concentrates in plasma or a platelet additive solution.Transfusion. 2014 Sep;54(9):2283-91. doi: 10.1111/trf.12634. Epub 2014 Mar 28. Transfusion. 2014. PMID: 24673482 Free PMC article.
-
Galactomannan antigenemia after infusion of gluconate-containing Plasma-Lyte.J Clin Microbiol. 2011 Dec;49(12):4330-2. doi: 10.1128/JCM.05031-11. Epub 2011 Oct 5. J Clin Microbiol. 2011. PMID: 21976760 Free PMC article.
-
Platelet concentrates prepared after a 20- to 24-hour hold of the whole blood at 22°C.Transfusion. 2012 Sep;52(9):2043-8. doi: 10.1111/j.1537-2995.2011.03546.x. Epub 2012 Feb 10. Transfusion. 2012. PMID: 22320682 Free PMC article.
-
The impact of platelet additive solution apheresis platelets on allergic transfusion reactions and corrected count increment (CME).Transfusion. 2014 Jun;54(6):1523-9; quiz 1522. doi: 10.1111/trf.12498. Epub 2013 Nov 19. Transfusion. 2014. PMID: 24251374 Free PMC article.
-
Fluid motion and shear forces in platelet storage bags with different modes of agitation.Vox Sang. 2016 Aug;111(2):209-12. doi: 10.1111/vox.12409. Epub 2016 Apr 14. Vox Sang. 2016. PMID: 27078040 Free PMC article.
References
-
- Adams GA, Swenson SD, Rock G. Survival and recovery of human platelets stored for five days in a non-plasma medium. Blood. 1986;67:672–5. - PubMed
-
- Rock G, Swenson SD, Adams GA. Platelet storage in a plasma-free medium. Transfusion. 1985;25:551–6. - PubMed
-
- Rock G, White J, Labow R. Storage of platelets in balanced salt solutions: A simple platelet storage medium. Transfusion. 1991;31:21–25. - PubMed
-
- Hillyer CD, Josephson CD, Blajchman MA, Vostal JG, Epstein JS, Goodman JL. Bacterial contamination of blood components: Risks, strategies, and regulation: joint ASH and AABB educational session in transfusion medicine. Hematology Am Soc Hematol Educ Program. 2003:575–89. - PubMed
-
- Lin L, Cook DN, Wiesehahn GP, Alfonso R, Behrman B, Cimino GD, Corten L, Damonte PB, Dikeman R, Dupuis K, Fang YM, Hanson CV, Hearst JE, Lin CY, Londe HF, Metchette K, Nerio AT, Pu JT, Reames AA, Rheinschmidt M, Tessman J, Isaacs ST, Wollowitz S, Corash L. Photochemical inactivation of viruses and bacteria in platelet concentrates by use of a noval psoralen and long-wavelength ultraviolet light. Transfusion. 1997;37:423–35. - PubMed
Publication types
MeSH terms
Grants and funding
LinkOut - more resources
Full Text Sources
Miscellaneous
