Comparative Study
. 2010 Oct;27(10):2268-83.
doi: 10.1093/molbev/msq113. Epub 2010 May 9.

The mixed lineage nature of nitrogen transport and assimilation in marine eukaryotic phytoplankton: a case study of micromonas

Affiliations
Comparative Study

The mixed lineage nature of nitrogen transport and assimilation in marine eukaryotic phytoplankton: a case study of micromonas

Sarah M McDonald et al. Mol Biol Evol. 2010 Oct.

Abstract

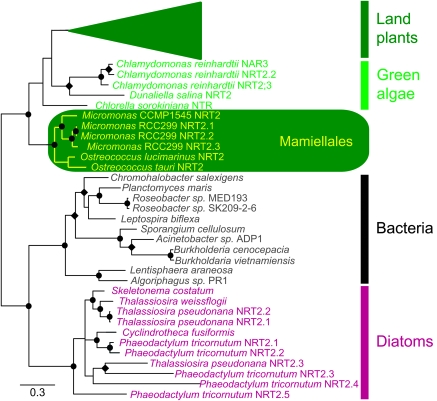
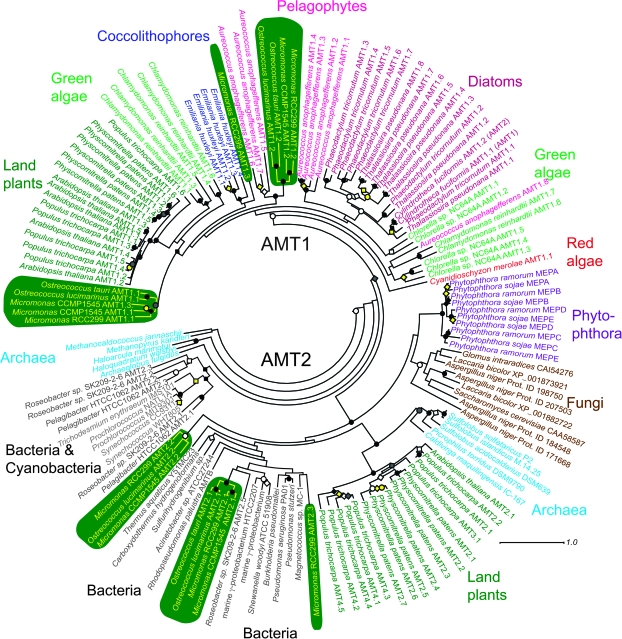
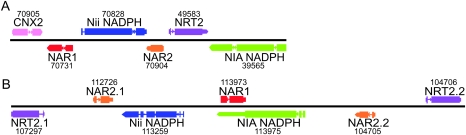
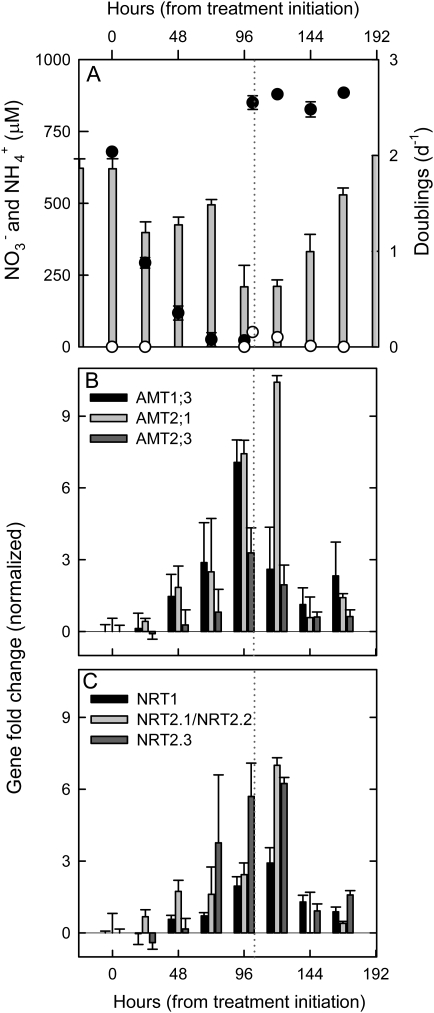
The prasinophyte order Mamiellales contains several widespread marine picophytoplankton (≤ 2 μm diameter) taxa, including Micromonas and Ostreococcus. Complete genome sequences are available for two Micromonas isolates, CCMP1545 and RCC299. We performed in silico analyses of nitrogen transporters and related assimilation genes in CCMP1545 and RCC299 and compared these with other green lineage organisms as well as Chromalveolata, fungi, bacteria, and archaea. Phylogenetic reconstructions of ammonium transporter (AMT) genes revealed divergent types contained within each Mamiellales genome. Some were affiliated with plant and green algal AMT1 genes and others with bacterial AMT2 genes. Land plant AMT2 genes were phylogenetically closer to archaeal transporters than to Mamiellales AMT2 genes. The Mamiellales represent the first green algal genomes to harbor AMT2 genes, which are not found in Chlorella and Chlamydomonas or the chromalveolate algae analyzed but are present in oomycetes. Fewer nitrate transporter (NRT) than AMT genes were identified in the Mamiellales. NRT1 was found in all but CCMP1545 and showed highest similarity to Mamiellales and proteobacterial NRTs. NRT2 genes formed a bootstrap-supported clade basal to other green lineage organisms. Several nitrogen-related genes were colocated, forming a nitrogen gene cluster. Overall, RCC299 showed the most divergent suite of nitrogen transporters within the various Mamiellales genomes, and we developed TaqMan quantitative polymerase chain reaction primer-probes targeting a subset of these, as well as housekeeping genes, in RCC299. All those investigated showed expression either under standard growth conditions or under nitrogen depletion. Like other recent publications, our findings show a higher degree of "mixed lineage gene affiliations" among eukaryotes than anticipated, and even the most phylogenetically anomalous versions appear to be functional. Nitrogen is often considered a regulating factor for phytoplankton populations. This study provides a springboard for exploring the use and functional diversification of inorganic nitrogen transporters and related genes in eukaryotic phytoplankton.


Figures

F<sc>IG</sc>. 1.
FIG. 1.
Unrooted Bayesian inference tree of nitrate transporter genes (NRT2) for various taxonomic groups. Symbols indicate posterior probabilities of 1 (circles) or between 0.95 and 0.99 (diamonds). The collapsed land plant group was composed of 33 NRT2 sequences from the following organisms: Arabidopsis thaliania, Brassica napus, Citris sinensis × Poncirus trifoliata, Cucumis sativus, Daucus carota, Glycine max, Hordem vulgare, Lotus japonicus, Lycopersicon esulentum, Nicotiana tabacum, Oryza sativa, Physcomitrella patens, Populus tremula × Populus tremuloides, Spinacia oleracea, Triticum aestivum, Vitis vinifera, and Zea mays. Accession numbers are provided in supplementary table S2, Supplementary Material online.
F<sc>IG</sc>. 2.
FIG. 2.
Unrooted maximum likelihood phylogenetic tree using protein sequences from AMT1 and AMT2 gene families from a selection of eukaryotes with sequenced genomes and from bacteria and archaea (some with sequenced genomes). Note that Chlamydomonas AMT1.2 is not shown but falls within Chlamydomonas subclass II. Transcripts of this gene have been cloned and sequenced, and the gene is present in the JGI v3 Chlamydomonas genome assembly, however, is missing from v4. Also AMT2B from O. tauri was not included because the 3' end of the gene sequence was truncated by a gap (in the genome sequence). Although S. cerevisiae has three MEPs, only one ScMEP is shown, although all three Aspergillus MEPs are included. Sequences at the most basal node (not shown) were AMT2.4 Roseobacter sp. SK209-2-6 (ZP_01755968), AMT2.4 Candidatus Pelagibacter ubique HTCC1062 (AAZ22114), and Silicibacter pomeroyi DSS-3 (YP_166819). Black symbols indicate bootstrap support between 95 and 100 (circles) or between 70 and 95 (diamonds) by both ML and NJ methods. White symbols represent the same for ML support only. Gray symbols represent the same for NJ methods only. Yellow symbols indicate bootstrap support between 95 and 100 (circles) for ML and 70 and 95 by NJ (circles) or 95 and 100 NJ and 70 and 95 ML support (diamonds). Accession numbers and gene model numbers are provided in supplementary table S5, Supplementary Material online.
F<sc>IG</sc>. 3.
FIG. 3.
Gene arrangements showing the relative positioning of colocated nitrogen genes along the chromosome (represented by black line) within CCMP1545 on scaffold 4, nucleotide positions 1572082-1585993 (A), and within RCC299 chromosome 1, positions 483935-509879 (B), and drawn approximately to scale. Homologous genes are color coded; pink indicates a nitrogen-associated gene that does not have a colocated homolog in the other Micromonas species.
F<sc>IG</sc>. 4.
FIG. 4.
Nitrogen-depletion experiment showing the mean nitrate (black) and ammonium (white) measurements throughout the time course (A) as well as growth rates for the triplicate RCC299 cultures shown starting 24 h prior to experiment initiation (gray bars). Normalized fold change in target gene expression, relative to expression levels at T0 of three AMT genes examined (B), and the three NRT transporter genes examined (C), with normalization as in Methods. Zero represents the time point at which cells were transferred into N-deplete K media and gray dotted line indicates amendment with NO3 and NH4+. Note: At T0, NH4+ was already below the 10 nM detection limit. In (A), (B), and (C), error bars represent the standard deviation within the triplicated biological treatments.

Similar articles

Cited by

References

    1. Abascal F, Zardoya R, Posada D. ProtTest: selection of best-fit models of protein evolution. Bioinformatics. 2005;21:2104–2105. - PubMed
    1. Allen AE. Beyond sequence homology: redundant ammonium transporters in a marine diatom are not functionally equivalent. J Phycol. 2005;41:4–6.
    1. Allen AE, Vardi A, Bowler C. An ecological and evolutionary context for integrated nitrogen metabolism and related signaling pathways in marine diatoms. Curr Opin Plant Biol. 2006;9:264–273. - PubMed
    1. Altschul SF, Madden TL, Schaffer AA, Zhang J, Zhang Z, Miller W, Lipman DJ. Gapped BLAST and PSI-BLAST: a new generation of protein database search programs. Nucleic Acids Res. 1997;25:3389–3402. - PMC - PubMed
    1. Andersson J. Horizontal gene transfer between microbial eukaryotes. In: Gogarten MB, Gogarten JP, Olendzenski L, editors. Horizontal gene transfer: genomes in flux. New York: Humana Press; 2009. pp. 473–487. - PubMed

Publication types

MeSH terms

LinkOut - more resources