. 2010 Jul 23;285(30):23359-70.
doi: 10.1074/jbc.M109.075143. Epub 2010 May 10.

The TOR complex 1 is distributed in endosomes and in retrograde vesicles that form from the vacuole membrane and plays an important role in the vacuole import and degradation pathway

Affiliations

The TOR complex 1 is distributed in endosomes and in retrograde vesicles that form from the vacuole membrane and plays an important role in the vacuole import and degradation pathway

C Randell Brown et al. J Biol Chem. .

Abstract

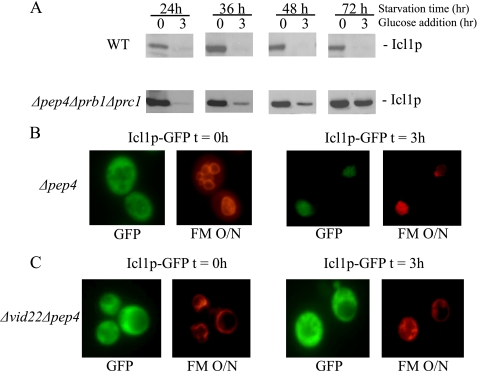
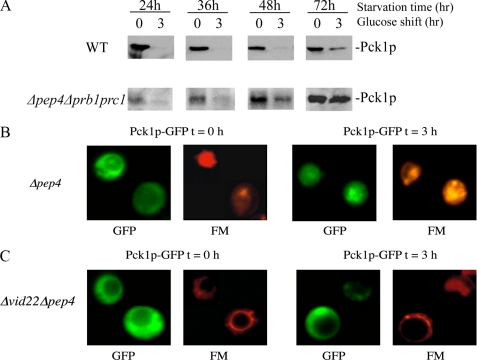
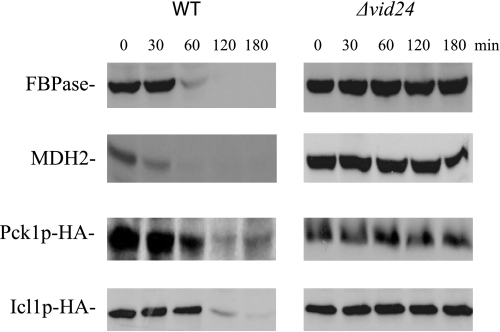
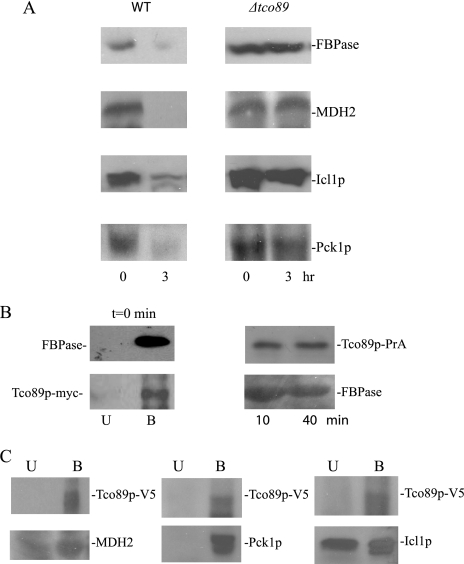
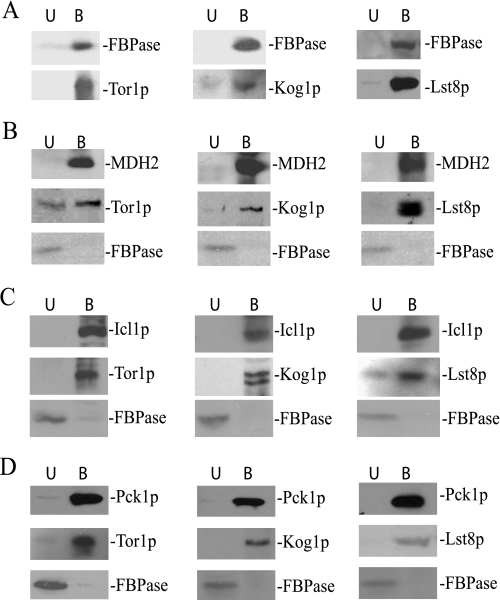
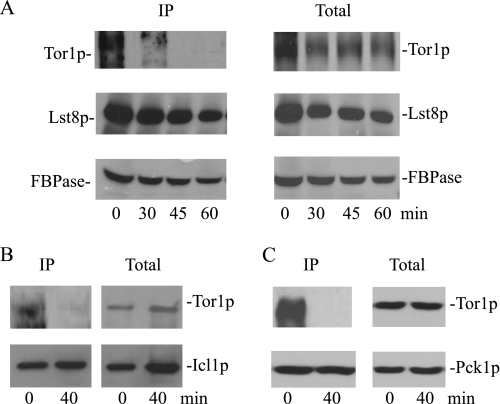
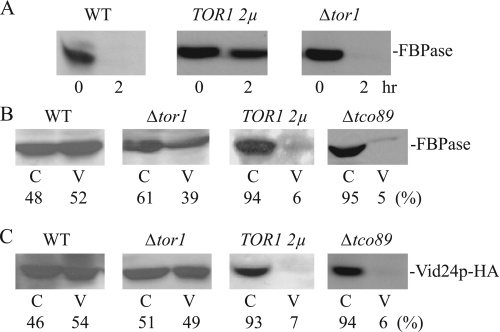
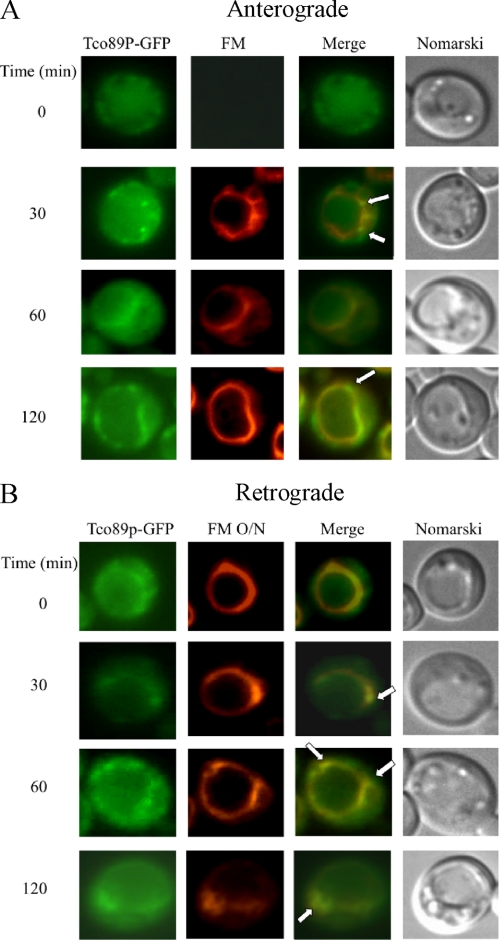
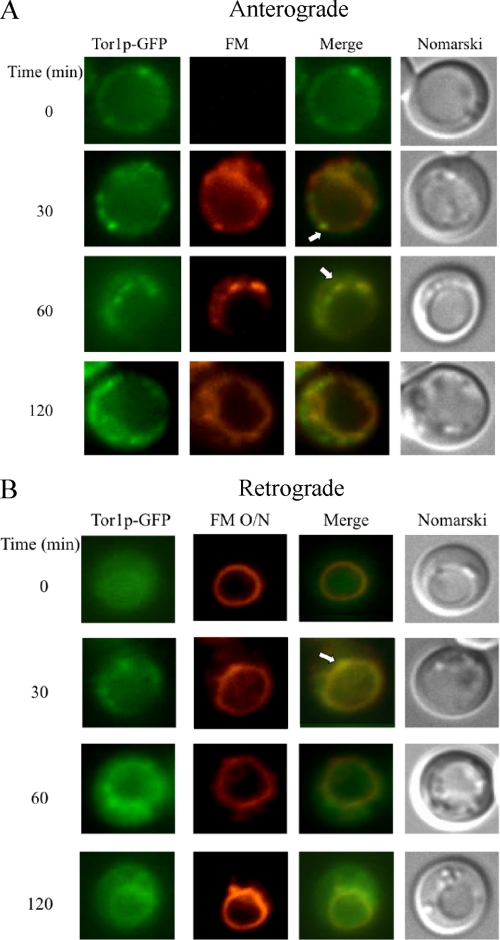
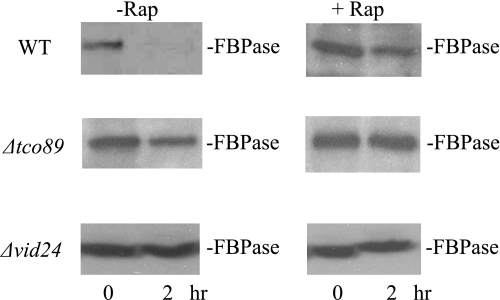
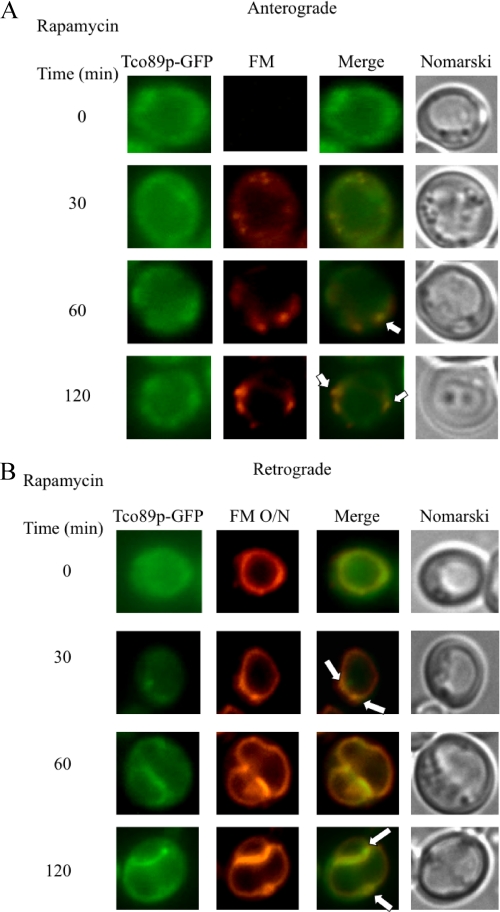
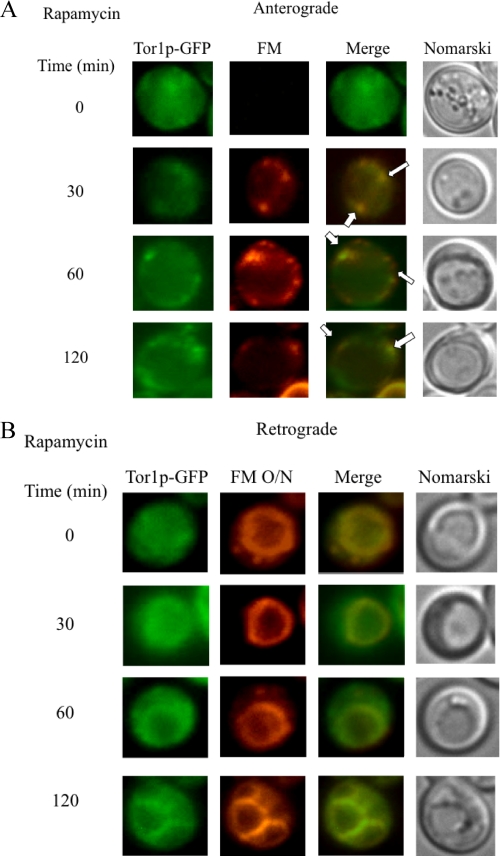
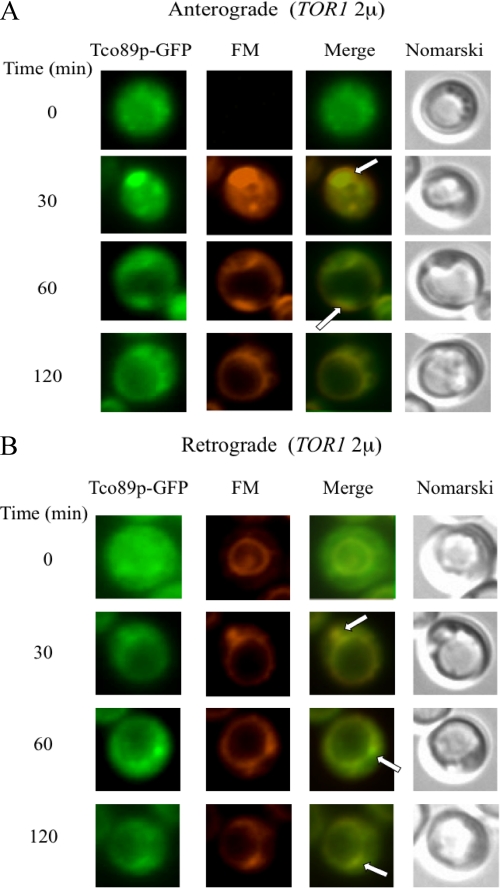
The key gluconeogenic enzyme fructose-1,6-bisphosphatase (FBPase) is induced when Saccharomyces cerevisiae are starved of glucose. However, when glucose is added to cells that have been starved for 3 days, FBPase is degraded in the vacuole. FBPase is first imported to Vid (vacuole import and degradation) vesicles, and these vesicles then merge with the endocytic pathway. In this report we show that two additional gluconeogenic enzymes, isocitrate lyase and phosphoenolpyruvate carboxykinase, were also degraded in the vacuole via the Vid pathway. These new cargo proteins and FBPase interacted with the TORC1 complex during glucose starvation. However, Tor1p was dissociated from FBPase after the addition of glucose. FBPase degradation was inhibited in cells overexpressing TOR1, suggesting that excessive Tor1p is inhibitory. Both Tco89p and Tor1p were found in endosomes coming from the plasma membrane as well as in retrograde vesicles forming from the vacuole membrane. When TORC1 was inactivated by rapamycin, FBPase degradation was inhibited. We suggest that TORC1 interacts with multiple cargo proteins destined for the Vid pathway and plays an important role in the degradation of FBPase in the vacuole.


Figures

FIGURE 1.
FIGURE 1.
Icl1p is targeted to the vacuole for degradation in 3-day-starved cells. A, wild type (WT) and Δpep4Δprb1Δprc1 cells expressing Icl1p-HA were starved for 24–72 h and then shifted to glucose. The degradation of Icl1p was examined by Western blotting. B, Icl1p-GFP was expressed in 3-day-starved Δpep4cells that were labeled with FM for 16 h to visualize the vacuole. Cells were then refed with glucose for 0 and 3 h. GFP and FM were visualized by fluorescence microscopy. O/N, overnight. C, Icl1p-GFP was expressed in the Δvid22Δpep4 cells that were starved for 3 days. FM was added to cells for 16 h to label the vacuole before glucose addition. Icl1p-GFP and FM were examined by fluorescence microscopy.
FIGURE 2.
FIGURE 2.
Pck1p is targeted to the vacuole in 3-day-starved Δpep4cells. A, wild type (WT) and Δpep4Δprb1Δprc1 cells expressing Pck1p-HA were glucose-starved for 24–72 h and then refed with glucose for 0 and 3 h. Pck1p degradation in response to glucose was examined. B, Pck1p-GFP was expressed in Δpep4 cells that were starved for 3 days. FM was added to cells for 16 h to label the vacuole. Cells were then transferred to media containing fresh glucose for 3 h, and Pck1p distribution was visualized using fluorescence microscopy. C, Pck1p-GFP was expressed in Δvid22Δpep4 double mutant that was starved for 3 days. FM was added to cells for 16 h to label the vacuole. Cells were then transferred to media containing fresh glucose for 0 and 3 h. Pck1p-GFP and FM were examined by fluorescence microscopy.
FIGURE 3.
FIGURE 3.
FBPase, MDH2, Pck1p, and Icl1p are degraded in response to glucose in a VID24 dependent manner. Wild type (WT) and Δvid24 mutants were transformed to express Pck1p-HA and Icl1p-HA individually. These cells were transferred to media containing fresh glucose for the indicated times, and their degradation was examined with anti-FBPase, anti-MDH2 antibodies, or with HA antibodies.
FIGURE 4.
FIGURE 4.
Tco89p is required for the degradation of FBPase, MDH2, Icl1p, and Pck1p. A, wild type (WT) cells and cells lacking TCO89 were starved for 3 days. Cells were then transferred to media containing fresh glucose for 0 and 3 h. The degradation of FBPase, MDH2, Icl1p, and Pck1p was examined. B, left panel, wild type strain expressing Tco89p-myc was starved for 3 days. FBPase was immunoprecipitated from total lysates at t = 0 min. The bound and unbound fractions were subjected to immunoblotting with anti-FBPase and anti-myc antibodies. Right panel, Tco89p-protein A fusion proteins were precipitated from wild type cells that were refed with fresh glucose for the indicated times. The bound fractions were blotted with anti-FBPase antibodies. C, Tco89p-V5-His6 fusion proteins were precipitated from wild type cells that expressed Pck1p-HA or Icl1p-HA. The presence of MDH2, Pck1p and Icl1p in the unbound (U) and bound (B) fractions was detected by Western blotting.
FIGURE 5.
FIGURE 5.
The TORC1 complex binds to proteins destined for the Vid pathway. A, FBPase was precipitated from wild type cells expressing Tor1p-HA, Kog1p-HA, or Lst8p-HA. The presence of these HA-tagged proteins was then detected in the unbound (U) and the bound (B) fractions. The tagged cells were used to precipitate MDH2 (B), Icl1p (C), and Pck1p (D) in total lysates. The HA-tagged proteins and FBPase in the unbound and bound fractions were then detected by Western blotting with anti-HA antibodies or anti-FBPase antibodies.
FIGURE 6.
FIGURE 6.
Tor1p is released from FBPase following a glucose shift. A, wild type cells expressing Tor1p-HA or Lst8p-HA were glucose-starved and then refed with fresh glucose for the indicated time points. FBPase was precipitated from total lysates, and the presence of Tor1p and Lst8p in the bound fractions was determined by Western blotting. Only one FBPase blot was shown. IP, immunoprecipitated. B and C, Icl1p and Pck1p were precipitated from cells expressing Tor1p-HA that were transferred from low to high glucose for 0 and 40 min. The kinetics of Tor1p-HA interaction with these proteins in the bound fraction was shown.
FIGURE 7.
FIGURE 7.
TOR1 overexpression inhibits FBPase degradation. A, wild type (WT) cells overexpressing TOR1 on multicopy plasmids and cells lacking this gene were examined for FBPase degradation. B and C, wild type cells, Δtor1cells, cells overexpressing TOR1, and the Δtco89 strain were glucose-starved for 3 days. These cells were transferred to media containing fresh glucose for 20 min. The distribution of FBPase and Vid24p in the cytosolic enriched (C) and the Vid vesicle enriched (V) fractions was examined. Relative ratios of FBPase and Vid24p in these fractions were quantitated by ImageJ software.
FIGURE 8.
FIGURE 8.
Tco89p can be found in multiple locations. A, wild type cells expressing Tco89p-GFP were transferred to media containing fresh glucose in the presence of FM for the indicated times. Tco89p-GFP and FM were visualized with fluorescence microscopy. Cells were visualized by Nomarski optics. B, wild type cells expressing Tco89p-GFP were labeled with FM for 16 h (FM O/N) and then refed with fresh glucose in the absence of FM for the indicated times. Tco89p-GFP, FM, and cells were visualized by fluorescence microscopy. Arrows indicate the co-localization of Tco89p-GFP with FM.
FIGURE 9.
FIGURE 9.
Tor1p is distributed in multiple locations. A, wild type cells expressing Tor1p-GFP were transferred from low to high glucose in the presence of FM for the indicated times. B, the vacuole was pre-labeled with FM for 16 h (FM O/N) in the same cells expressing Tor1p-GFP. Cells were then transferred to media containing fresh glucose in the absence of FM for the indicated times. Tor1p-GFP and FM were visualized with fluorescence microscopy. Arrows indicate the co-localization of Tor1p-GFP with FM.
FIGURE 10.
FIGURE 10.
Rapamycin inhibits FBPase degradation. Wild type (WT), Δtco89, and Δvid24 strains were glucose starved for 3 days and transferred to media containing fresh glucose in the absence or presence of rapamycin. FBPase degradation was then examined.
FIGURE 11.
FIGURE 11.
Tco89p distribution in response to rapamycin. A, Tco89p-GFP cells were glucose-starved for 3 days and then transferred to media containing fresh glucose and FM in the presence of rapamycin for the indicated times. Tco89p-GFP, FM, and cells were visualized by fluorescence microscopy. B, the vacuole of the Tco89p-GFP cells was pre-labeled with FM for 16 h (FM O/N). The distribution of Tco89p-GFP after the addition of glucose in the presence of rapamycin was observed by fluorescence microscopy. Co-localization of Tco89p-GFP with FM is indicated by arrows.
FIGURE 12.
FIGURE 12.
Tor1p distribution in response to rapamycin. A, wild type cells expressing Tor1p-GFP were glucose-starved for 3 days and transferred to media containing fresh glucose. FM and rapamycin were added to the media, and Tor1p-GFP and FM were observed using fluorescence microscopy. Co-localization of Tor1p-GFP with FM is indicated by arrows. B, the same cells were incubated with FM for 16 h (FM O/N) to pre-label vacuoles. Cells were then transferred to media containing fresh glucose in the presence of rapamycin for the indicated times. Tor1p-GFP, FM, and cells were visualized using fluorescence microscopy.
FIGURE 13.
FIGURE 13.
Tco89p-GFP distribution in cells overexpressing TOR1. A, wild type cells expressing Tco89p-GFP were transformed to overproduce TOR1 on a multicopy plasmid. Cells were starved for 3 days and transferred to media containing fresh glucose and FM for the indicated times. Co-localization of Tco89p-GFP with FM is indicated by arrows. B, FM was added to the same cells for 16 h (FM O/N) to pre-label vacuoles. Cells were then transferred to media containing fresh glucose in the absence of FM for the indicated times. Tco89p-GFP, FM, and cells were visualized using fluorescence microscopy. Arrows indicate the co-localization of Tco89p-GFP with FM.

Similar articles

Cited by

References

    1. Jones E. W. (1991) J. Biol. Chem. 266, 7963–7966 - PubMed
    1. Bryant N. J., Stevens T. H. (1998) Microbiol. Mol. Biol. Rev. 62, 230–247 - PMC - PubMed
    1. Klionsky D. J., Herman P. K., Emr S. D. (1990) Microbiol. Rev. 54, 266–292 - PMC - PubMed
    1. Raymond C. K., Howald-Stevenson I., Vater C. A., Stevens T. H. (1992) Mol. Biol. Cell 3, 1389–1402 - PMC - PubMed
    1. Rothman J. H., Stevens T. H. (1986) Cell 47, 1041–1051 - PubMed

Publication types

MeSH terms