. 2010 Jul 9;285(28):21888-901.
doi: 10.1074/jbc.M110.116293. Epub 2010 May 10.

Roles of fragile X mental retardation protein in dopaminergic stimulation-induced synapse-associated protein synthesis and subsequent alpha-amino-3-hydroxyl-5-methyl-4-isoxazole-4-propionate (AMPA) receptor internalization

Affiliations

Roles of fragile X mental retardation protein in dopaminergic stimulation-induced synapse-associated protein synthesis and subsequent alpha-amino-3-hydroxyl-5-methyl-4-isoxazole-4-propionate (AMPA) receptor internalization

Hansen Wang et al. J Biol Chem. .

Abstract

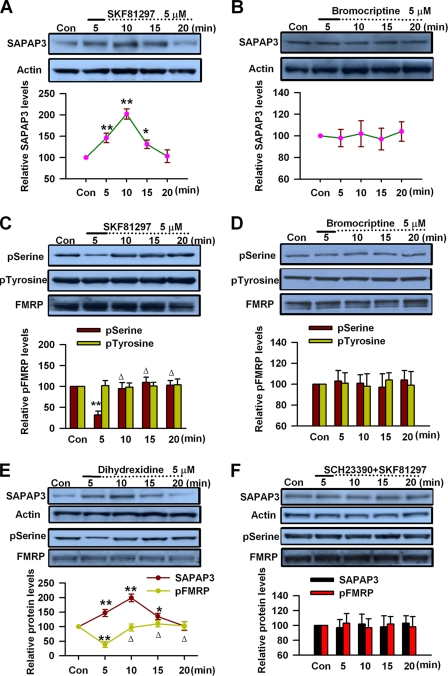
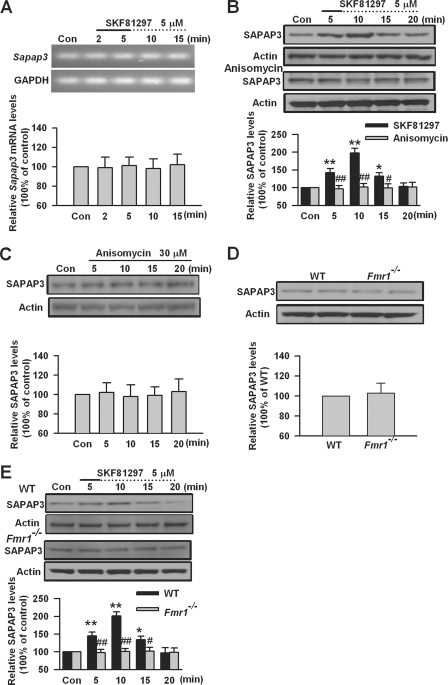
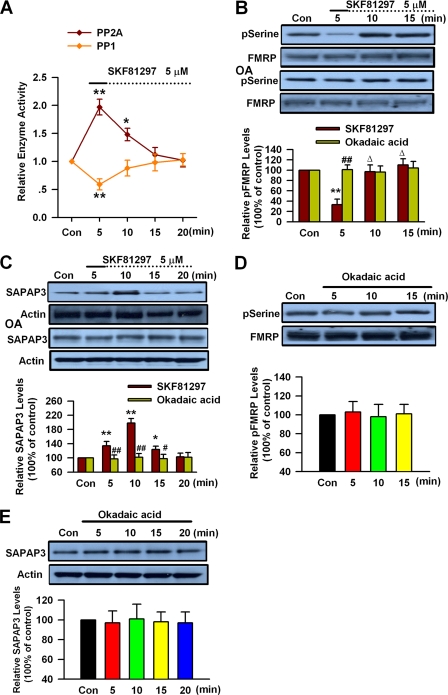
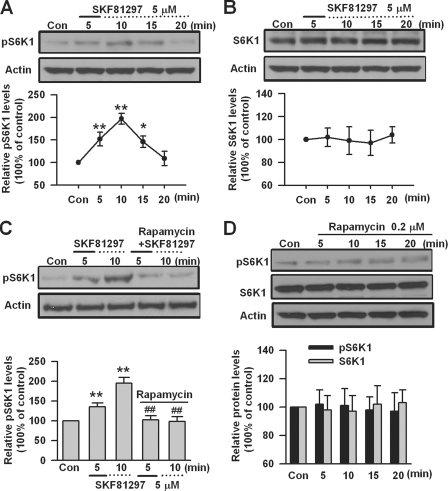
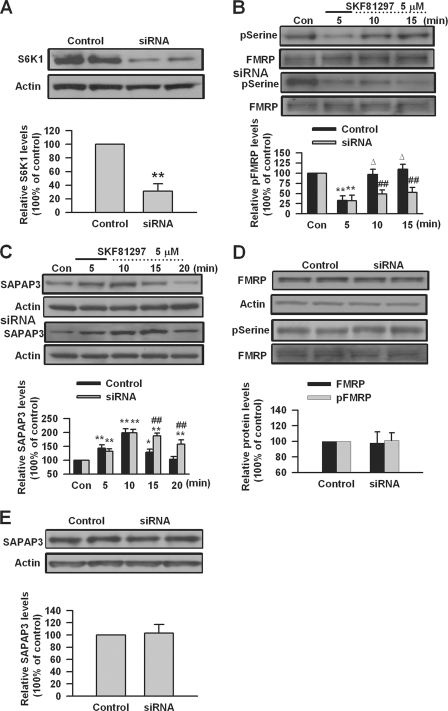
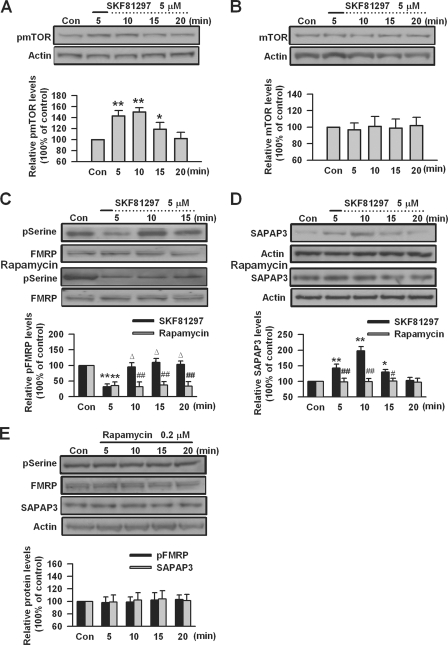
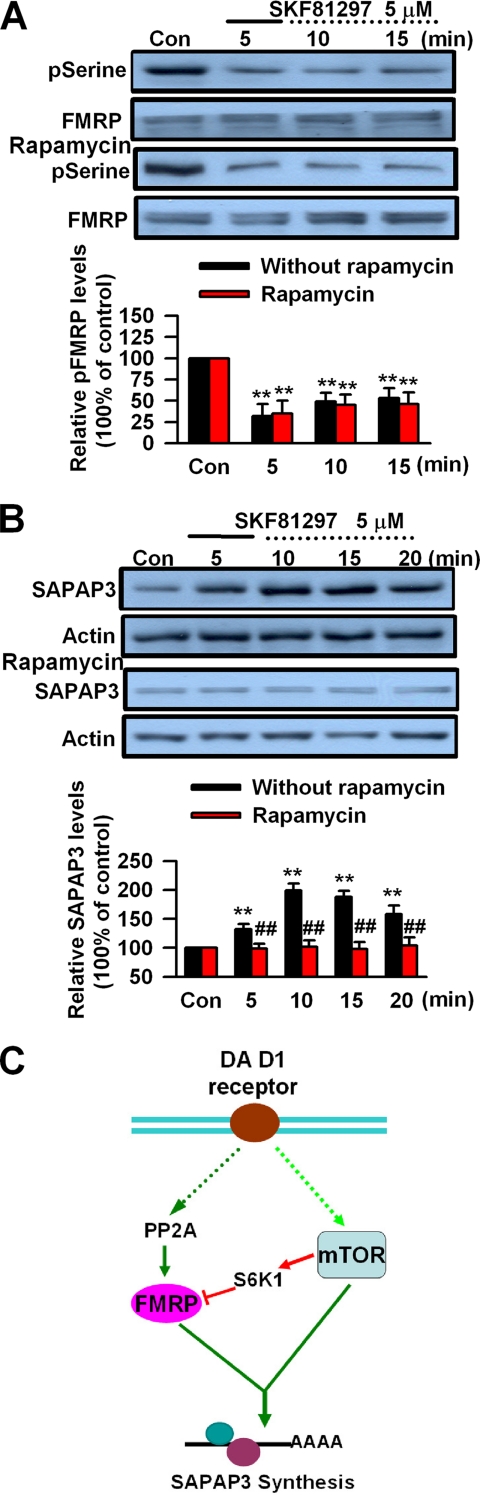
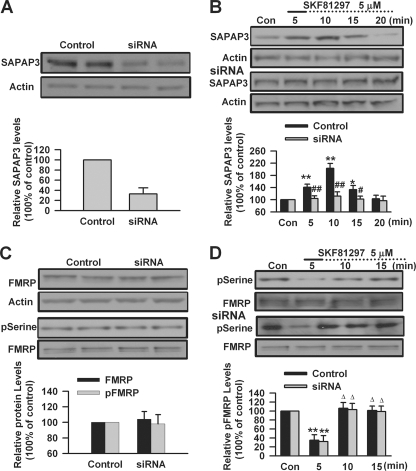
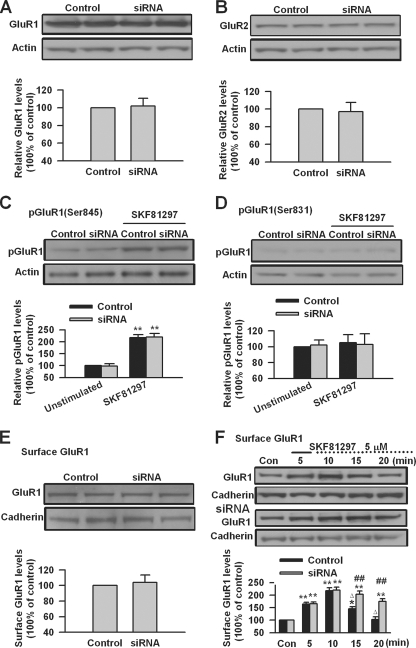
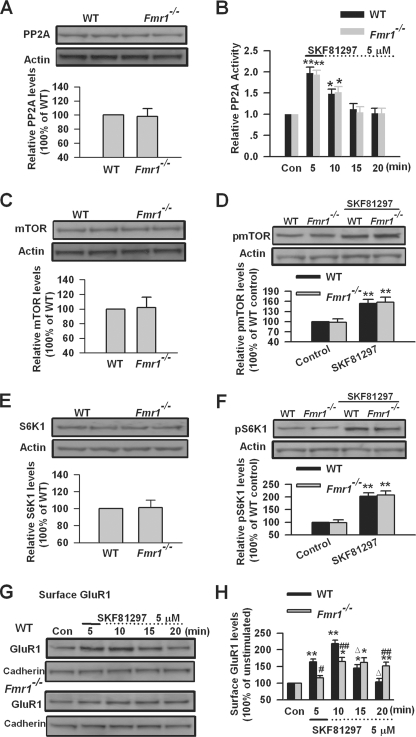
Fragile X syndrome, the most common form of inherited mental retardation, is caused by the absence of the RNA-binding protein fragile X mental retardation protein (FMRP). FMRP regulates local protein synthesis in dendritic spines. Dopamine (DA) is involved in the modulation of synaptic plasticity. Activation of DA receptors can regulate higher brain functions in a protein synthesis-dependent manner. Our recent study has shown that FMRP acts as a key messenger for DA modulation in forebrain neurons. Here, we demonstrate that FMRP is critical for DA D1 receptor-mediated synthesis of synapse-associated protein 90/PSD-95-associated protein 3 (SAPAP3) in the prefrontal cortex (PFC). DA D1 receptor stimulation induced dynamic changes of FMRP phosphorylation. The changes in FMRP phosphorylation temporally correspond with the expression of SAPAP3 after D1 receptor stimulation. Protein phosphatase 2A, ribosomal protein S6 kinase, and mammalian target of rapamycin are the key signaling molecules for FMRP linking DA D1 receptors to SAPAP3. Knockdown of SAPAP3 did not affect surface expression of alpha-amino-3-hydroxyl-5-methyl-4-isoxazole-4-propionate (AMPA) GluR1 receptors induced by D1 receptor activation but impaired their subsequent internalization in cultured PFC neurons; the subsequent internalization of GluR1 was also impaired in Fmr1 knock-out PFC neurons, suggesting that FMRP may be involved in subsequent internalization of GluR1 through regulating the abundance of SAPAP3 after DA D1 receptor stimulation. Our study thus provides further insights into FMRP involvement in DA modulation and may help to reveal the molecular mechanisms underlying impaired learning and memory in fragile X syndrome.


Figures

FIGURE 1.
FIGURE 1.
The effect of DA receptor activation on SAPAP3 and FMRP phosphorylation in prefrontal cortical slices. A, DA D1 receptor agonist SKF81297 (5 μm, 5 min) caused a time-dependent increase of SAPAP3 expression in PFC slices. B, DA D2 receptor agonist bromocriptine (5 μm, 5 min) did not affect SAPAP3 expression. C, SKF81297 (5 μm, 5 min) caused time-dependent changes of FMRP phosphorylation at serine residues, whereas the phosphorylation at tyrosine residues was not affected. D, bromocriptine (5 μm, 5 min) did not affect FMRP phosphorylation at serine or tyrosine residues. E, D1 receptor agonist dihydrexidine (5 μm, 5 min) treatment caused time-dependent increase of SAPAP3 expression and changes of FMRP phosphorylation at serine residues in PFC slices. F, D1 receptor agonist SKF81297 (5 μm, 5 min) did not affect SAPAP3 expression or FMRP phosphorylation at serine residues in the presence of D1 receptor antagonist SCH23390 (5 μm); SCH23390 was applied 5 min prior to and during SKF81297 treatment. The slices were treated with DA D1 or D2 receptor agonists for the first 5 min (solid lines) and incubated to the time points as indicated by the dotted lines after the drugs were washed out. Representative Western blots (top panels) and quantification data (bottom panels) are shown. n = 6 mice in A and C; n = 5 mice in B and D–F; *, p < 0.05, and **, p < 0.01, compared with control; Δ, p < 0.01, compared with 5-min time point. The data were calculated as ratios to loading controls and then normalized by the values of control conditions. Con, control.
FIGURE 2.
FIGURE 2.
DA D1 receptor-mediated SAPAP3 expression was protein synthesis-dependent and abolished in PFC of Fmr1−/− mice. A, DA D1 receptor agonist SKF81297 (5 μm, 2 and 5 min) did not affect the levels of Sapap3 mRNA in PFC slices, as shown by RT-PCR. The sizes of PCR products are 142 and 191 bp for Sapap3 and glyceraldehyde-3-phosphate dehydrogenase (GAPDH), respectively. Representative gels (top panel) and quantification data (bottom panel) of Sapap3 mRNA are shown. B, the protein synthesis inhibitor anisomycin (30 μm) could block SKF81297-induced (5 μm, 5 min) SAPAP3 expression in PFC slices. Anisomycin was applied 5 min prior to and during SKF81297 treatment. C, anisomycin (30 μm) did not affect SAPAP3 expression in PFC slices. D, the basal SAPAP3 expression was not altered in PFC of Fmr1−/− mice. E, SKF81297 (5 μm) did not affect SAPAP3 expression in PFC of Fmr1−/− mice. The slices were treated with DA D1 receptor agonist for the first 5 min (solid line) and incubated to the time points as indicated by the dotted lines after the drugs were washed out. Representative Western blots (top panel) and quantification data (bottom panel) of protein levels are shown in B–E. *, p < 0.05, and **, p < 0.01, compared with control in B and E; #, p < 0.05, and ##, p < 0.01, compared with SKF81297 treatment in B, compared with WT in E. The data were calculated as ratios to loading controls and then normalized by the values of control conditions in A–C and E and by WT values in D; n = 6 mice for each group in B and D, n = 4 mice in A and C, and n = 5 mice in E. Con, control.
FIGURE 3.
FIGURE 3.
PP2A is involved in DA-mediated changes of FMRP phosphorylation and SAPAP3 expression. A, measurement of PP2A and PP1 activity. D1 agonist SKF81297 (5 μm, 5 min) caused transient activation of PP2A and slight inhibition of PP1 in PFC slices. B and C, the PP2A inhibitor okadaic acid (OA, 1 nm) abolished the changes of FMRP phosphorylation (B) and SAPAP3 expression (C) induced by SKF81297 (5 μm, 5 min). Okadaic acid was applied 5 min prior to and during SKF81297 treatment. D and E, okadaic acid (1 nm) did not affect the basal FMRP phosphorylation (D) and SAPAP3 expression (E) in PFC slices. The slices were treated with DA D1 receptor agonist for the first 5 min (solid lines) and incubated to the time points as indicated by the dotted lines after the drugs were washed out. Representative Western blots (top panel) and quantification data (bottom panel) are shown in B–E. *, p < 0.05, and **, p < 0.01, compared with control in A–C; #, p < 0.05, and ##, p < 0.01, compared with SKF81297 treatment in B and C; Δ, p < 0.01, compared with 5-min time point in B. The data were normalized by control values in A. For Western blot, the data were calculated as ratios to loading controls and then normalized by the values of control conditions in B–E. n = 5 mice for each group in A–C, and n = 4 mice in D and E. Con, control.
FIGURE 4.
FIGURE 4.
The activation of S6K1 by DA D1 receptors. A, DA D1 agonist SKF81297 (5 μm, 5 min) increased the phosphorylation of S6K1 (Thr389) in a time-dependent manner. B, SKF81297 (5 μm, 5 min) did not affect the basal levels of S6K1 in PFC slices. C, the mTOR inhibitor rapamycin (0.2 μm) could block SKF81297-induced S6K1 phosphorylation (Thr389) in PFC slices. Rapamycin was applied 5 min prior to and during SKF81297 (5 μm, 5 min) treatment. D, application of rapamycin (0.2 μm) did not affect the phosphorylation or basal expression of S6K1 in PFC slices. The slices were treated with DA D1 receptor agonist for the first 5 min (solid lines) and incubated to the time points as indicated by the dotted lines after the drugs were washed out. Representative Western blots (top) and quantification data (bottom) are shown in A–D. *, p < 0.05, and **, p < 0.01, compared with control in A and C; #, p < 0.05, and ##, p < 0.01, compared with SKF81297 treatment in C. The data were calculated as ratios to loading controls and then normalized by the values of control conditions. n = 5 mice for each group in A–C, and n = 4 mice for each group in D. Con, control.
FIGURE 5.
FIGURE 5.
The effect of S6K1 knockdown on FMRP phosphorylation and SAPAP3 expression mediated by DA D1 receptors. A, S6K1 siRNA could reduce S6K1 expression in cultured PFC neurons. B, transfection of S6K1 siRNA did not affect FMRP dephosphorylation at serine residues but blocked the subsequent rephosphorylation after DA D1 receptor agonist SKF81297 (5 μm, 5 min) treatment. C, S6K1 siRNA did not affect the up-regulation of SAPAP3 but could impair the decrease of up-regulated SAPAP3 after SKF81297 (5 μm, 5 min) treatment in cultured PFC neurons. D and E, S6K1 siRNA did not affect basal expression, phosphorylation of FMRP (D), and SAPAP3 expression (E). siRNA was transfected into cultured PFC neurons (day in vitro 16) 40 h before experiments. PFC neurons were treated with DA D1 receptor agonist for the first 5 min (solid lines) and incubated to the time points as indicated by the dotted lines after the drugs were washed out. Representative Western blots (top panels) and quantification data (bottom panels) are shown in A–E. *, p < 0.05, and **, p < 0.01, compared with control siRNA in A–C; ##, p < 0.01, compared with control siRNA in B and C; Δ p < 0.01, compared with 5-min time point in B. The data were calculated as ratios to loading controls and then normalized by the values of control conditions. n = 4 dishes for each group in A, D, and E, and n = 5 dishes in B and C. Con, control.
FIGURE 6.
FIGURE 6.
mTOR is involved in SAPAP3 expression mediated by DA D1 receptors. A, DA D1 agonist SKF81297 (5 μm, 5 min) increased the phosphorylation of mTOR (Ser2448) in a time-dependent manner. B, SKF81297 (5 μm, 5 min) did not affect the basal levels of mTOR in PFC slices. C, the mTOR inhibitor rapamycin (0.2 μm) did not affect FMRP dephosphorylation at serine residues but blocked the subsequent rephosphorylation after SKF81297 (5 μm, 5 min) treatment. D, rapamycin (0.2 μm) could block SKF81297-induced SAPAP3 expression in PFC slices. Rapamycin was applied 5 min prior to and during SKF81297 treatment. E, rapamycin (0.2 μm) did not affect the basal levels of FMRP phosphorylation and SAPAP3 expression in PFC slices. The slices were treated with DA D1 receptor agonist for the first 5 min (solid lines) and incubated to the time points as indicated by the dotted lines after the drugs were washed out. Representative Western blots (top panels) and quantification data (bottom panels) are shown in A–E. *, p < 0.05, and **, p < 0.01, compared with control in A, C, and D; #, p < 0.05, and ##, p < 0.01, compared with SKF81297 treatment in C and D; Δ, p < 0.01, compared with the 5-min time point in C. The data were calculated as ratios to loading controls and then normalized by the values of control conditions. n = 5 mice in A, C, and D, and n = 4 mice in B and E. Con, control.
FIGURE 7.
FIGURE 7.
Pharmacological inhibition of mTOR in S6K1 knockdown PFC neurons. A, the mTOR inhibitor rapamycin (0.2 μm) did not affect FMRP phosphorylation at serine residues in S6K1 knockdown-cultured PFC neurons treated with SKF81297 (5 μm, 5 min). B, rapamycin (0.2 μm) blocked SKF81297-induced (5 μm, 5 min) SAPAP3 expression in S6K1 knockdown-cultured PFC neurons. C, a model of signaling pathways for DA D1 receptor-mediated SAPAP3 expression. Both FMRP and mTOR are required for initiation of SAPAP3 synthesis. PP2A dephosphorylates FMRP, and dephosphorylated FMRP is involved in the initiation of SAPAP3 synthesis. The mTOR also activates S6K1, which phosphorylates FMRP, and phosphorylated FMRP acts as a repressor for SAPAP3 synthesis. PFC neurons were treated with DA D1 receptor agonist for the first 5 min (solid lines) and incubated to the time points as indicated by the dotted lines after the drugs were washed out. Representative Western blots (top panels) and quantification data (bottom panels) are shown in A and B. **, p < 0.01, compared with control in A and B; ##, p < 0.01, compared with S6K1 siRNA only in B. The data were calculated as ratios to loading controls and then normalized by the values of control conditions. n = 5 dishes for each group in A and B. Con, control.
FIGURE 8.
FIGURE 8.
Knockdown of SAPAP3 in cultured PFC neurons. A, SAPAP3 siRNA could knock down SAPAP3 expression in cultured PFC neurons. B, SAPAP3 siRNA could block DA D1 receptor agonist SKF81297-induced (5 μm, 5 min) changes of SAPAP3 expression that were observed in cultured PFC neurons transfected with control siRNA. C, transfection of SAPAP3 siRNA did not affect the basal expression and phosphorylation (serine residues) levels of FMRP. D, SKF81297 (5 μm, 5 min) could induce the changes of FMRP phosphorylation in cultured PFC neurons; Transfection of SAPAP3 siRNA did not affect the changes of FMRP phosphorylation caused by SKF81297 treatment. siRNA was transfected into cultured PFC neurons (day in vitro 16) 40 h before experiments. PFC neurons were treated with DA D1 receptor agonist for the first 5 min (solid lines) and incubated to the time points as indicated by the dotted lines after the drugs were washed out. Representative Western blots (top) and quantification data (bottom) are shown in A–D. *, p < 0.05, and **, p < 0.01, compared with control in A, B, and D; #, p < 0.05, and ##, p < 0.01, compared with control siRNA in B; Δ, p < 0.01, compared with 5-min time point in D. The data were calculated as ratios to loading controls and then normalized by the values of control conditions. n = 4 dishes in A and C, and n = 5 dishes for each group in B and D. Con, control.
FIGURE 9.
FIGURE 9.
The effect of SAPAP3 knockdown on AMPA receptors after D1 receptor activation in PFC neurons. A and B, transfection of SAPAP3 siRNA did not affect the basal levels of AMPA receptor GluR1 (A) or GluR2 (B) subunits. C and D, SAPAP3 siRNA did not affect the basal levels of GluR1 phosphorylation at residues Ser845 (C) or Ser831 (D) in cultured PFC neurons. E, SAPAP3 siRNA did not affect basal GluR1 surface expression in cultured PFC neurons as measured by biotinylation assay. F, SAPAP3 siRNA did not affect the increase of surface GluR1 but impaired the decrease of the increased surface GluR1 after SKF81297 (5 μm, 5 min) treatment in cultured PFC neurons. siRNA was transfected into cultured PFC neurons (day in vitro 16) 40 h before experiments. PFC neurons were treated with DA D1 receptor agonist for the first 5 min (solid lines) and incubated to the time points as indicated by the dotted lines after the drugs were washed out. Representative Western blots (top) and quantification data (bottom) are shown in A–F. *, p < 0.05, and **, p < 0.01, compared with control in C and F; ##, p < 0.01, compared with control siRNA in F; Δ, p < 0.01, compared with the 10-min time point in F. The data were calculated as ratios to loading controls and then normalized by the values of control conditions. n = 4 dishes in A–E, and n = 6 dishes for each group in F. Con, control.
FIGURE 10.
FIGURE 10.
AMPA receptor GluR1 surface expression after DA D1 receptor activation in Fmr1 KO PFC neurons. A and B, the basal PP2A levels (A) and PP2A activation (B) after SKF81297 (5 μm, 5 min) treatment were not altered in a PFC slice of Fmr1 KO mice. C and D, the basal mTOR levels (C) and mTOR phosphorylation (D) after SKF8129 treatment were not altered in a PFC slice of Fmr1 KO mice. E and F, the basal S6K1 levels (E) and S6K1 phosphorylation (Thr389) (F) after SKF81297 treatment were not altered in a PFC slice of Fmr1 KO mice. G and H, the increase of surface GluR1was partially blocked, and the decreases of the increased surface GluR1 levels were impaired after SKF81297 (5 μm, 5 min) treatment in PFC slices of Fmr1 KO mice compared with WT mice, as measured by biotinylation assay. The slices were treated with DA D1 receptor agonist for the first 5 min (solid lines) and incubated to the time points as indicated by the dotted lines after the drugs were washed out. *, p < 0.05, and **, p < 0.01, compared with control in B, D, F, and H; ##, p < 0.01, compared with WT in H; Δ, p < 0.01, compared with 10-min time point in H. The data were calculated as ratios to loading controls and then normalized by the values of control conditions. n = 6 mice in A and C–F, and n = 5 mice for each group in B, G, and H. Con, control.

Similar articles

Cited by

References

    1. Bassell G. J., Warren S. T. (2008) Neuron 60, 201–214 - PMC - PubMed
    1. Bear M. F., Huber K. M., Warren S. T. (2004) Trends Neurosci. 27, 370–377 - PubMed
    1. Belmonte M. K., Bourgeron T. (2006) Nat. Neurosci. 9, 1221–1225 - PubMed
    1. Feng Y., Zhang F., Lokey L. K., Chastain J. L., Lakkis L., Eberhart D., Warren S. T. (1995) Science 268, 731–734 - PubMed
    1. Terracciano A., Chiurazzi P., Neri G. (2005) Am. J. Med. Genet. C Semin. Med. Genet. 137c, 32–37 - PubMed

Publication types

LinkOut - more resources