

Effects of respiratory muscle work on blood flow distribution during exercise in heart failure
- PMID: 20457736
- PMCID: PMC2915522
- DOI: 10.1113/jphysiol.2009.186056
Effects of respiratory muscle work on blood flow distribution during exercise in heart failure
Abstract
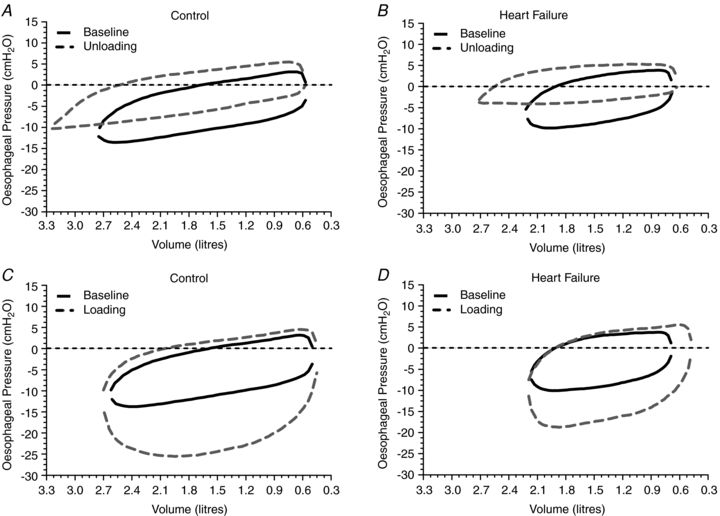
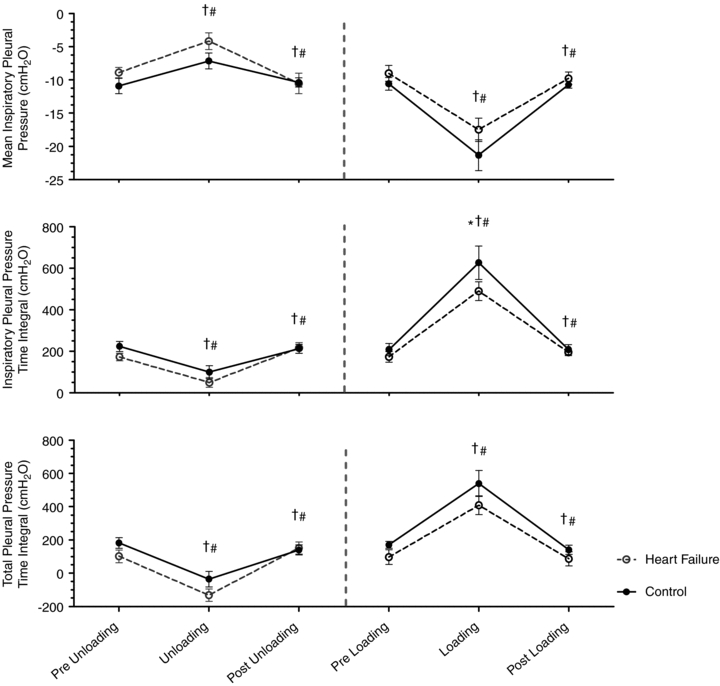
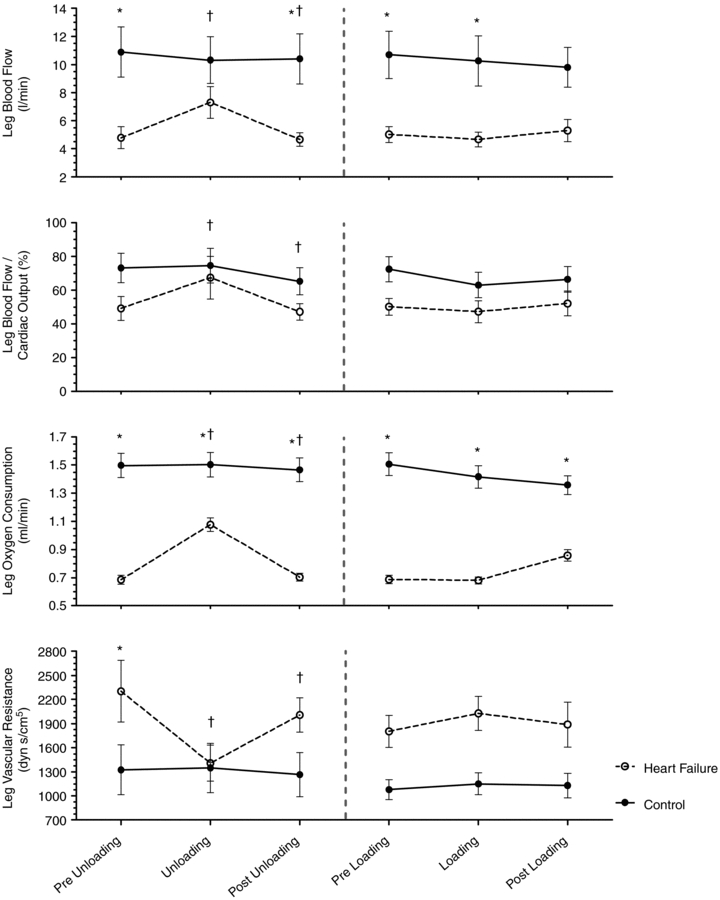
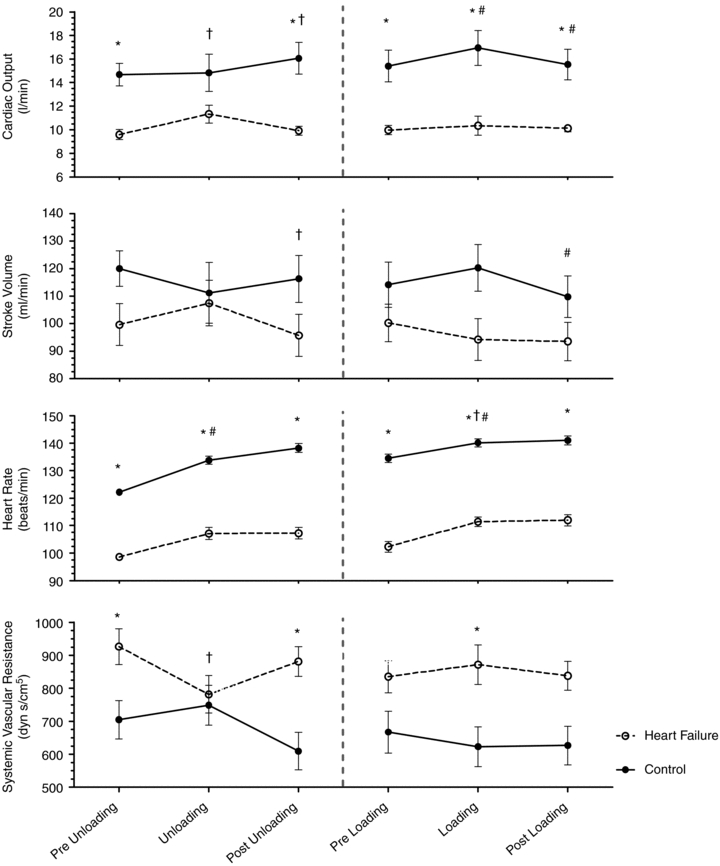
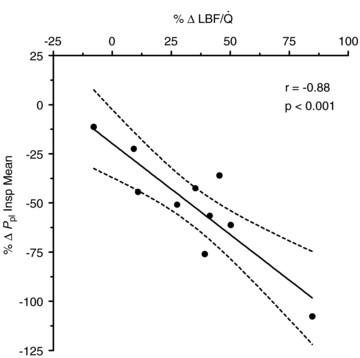
Heart failure (HF) patients have a reduced cardiac reserve and increased work of breathing. Increased locomotor muscle blood flow demand may result in competition between respiratory and locomotor vascular beds. We hypothesized that HF patients would demonstrate improved locomotor blood flow with respiratory muscle unloading during activity. Ten patients (ejection fraction = 31 +/- 3%) and 10 controls (CTL) underwent two cycling sessions (60% peak work). Session 1 (S1): 5 min of normal breathing (NB), 5 min respiratory muscle unloading with a ventilator, and 5 min of NB. Session 2 (S2): 5 min NB, 5 min of respiratory muscle loading with inspiratory resistance, and 5 min of NB. Measurements included: leg blood flow (LBF, thermodilution), cardiac output (Q), and oesophageal pressure (P(pl), index of pleural pressure). S1: P(pl) was reduced in both groups (HF: 73 +/- 8%; CTL: 60 +/- 13%, P < 0.01). HF: Q increased (9.6 +/- 0.4 vs. 11.3 +/- 0.8 l min(-1), P < 0.05) and LBF increased (4.8 +/- 0.8 vs. 7.3 +/- 1.1 l min(-1), P < 0.01); CTL: no changes in Q (14.7 +/- 1.0 vs. 14.8 +/- 1.6 l min(-1)) or LBF (10.9 +/- 1.8 vs. 10.3 +/- 1.7 l min(-1)). S2: P(pl) increased in both groups (HF: 172 +/- 16%, CTL: 220 +/- 40%, P < 0.01). HF: no change was observed in Q(10.0 +/- 0.4 vs. 10.3 +/- 0.8 l min(-1)) or LBF (5.0 +/- 0.6 vs. 4.7 +/- 0.5 l min(-1)); CTL: increased (15.4 +/- 1.4 vs. 16.9 +/- 1.5 l min(-1), P < 0.01) and LBF remained unchanged (10.7 +/- 1.5 vs. 10.3 +/- 1.8 l min(-1)). These data suggest HF patients preferentially steal blood flow from locomotor muscles to accommodate the work of breathing during activity. Further, HF patients are unable to vasoconstrict locomotor vascular beds beyond NB when presented with a respiratory load.
Figures
Comment in
-
Cardiorespiratory responses to exercise in CHF: a conspiracy of maladaptation.J Physiol. 2010 Aug 1;588(Pt 15):2683. doi: 10.1113/jphysiol.2010.193805. J Physiol. 2010. PMID: 20675813 Free PMC article. No abstract available.
References
-
- Aaron EA, Seow KC, Johnson BD, Dempsey JA. Oxygen cost of exercise hyperpnea: implications for performance. J Appl Physiol. 1992;72:1818–1825. - PubMed
-
- Beck KC, Hyatt RE, Mpougas P, Scanlon PD. Evaluation of pulmonary resistance and maximal expiratory flow measurements during exercise in humans. J Appl Physiol. 1999;86:1388–1395. - PubMed
-
- Borghi-Silva A, Carrascosa C, Oliveira CC, Barroco AC, Berton DC, Vilaca D, Lira-Filho EB, Ribeiro D, Nery LE, Neder JA. Effects of respiratory muscle unloading on leg muscle oxygenation and blood volume during high-intensity exercise in chronic heart failure. Am J Physiol Heart Circ Physiol. 2008;294:H2465–H2472. - PubMed
Publication types
MeSH terms
Grants and funding
LinkOut - more resources
Full Text Sources
Other Literature Sources
Medical
Research Materials
Miscellaneous