. 2010 May 17;189(4):701-12.
doi: 10.1083/jcb.200912142. Epub 2010 May 10.

Sox10 is required for Schwann cell identity and progression beyond the immature Schwann cell stage

Affiliations

Sox10 is required for Schwann cell identity and progression beyond the immature Schwann cell stage

Markus Finzsch et al. J Cell Biol. .

Abstract

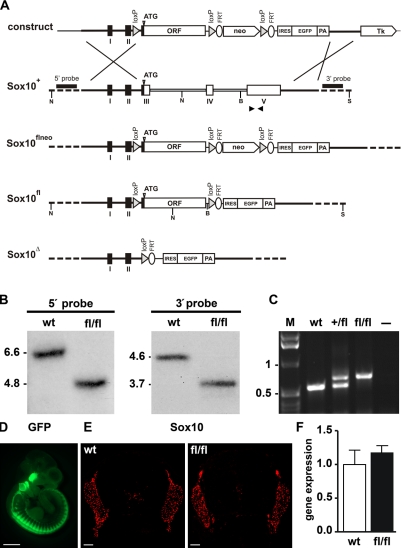
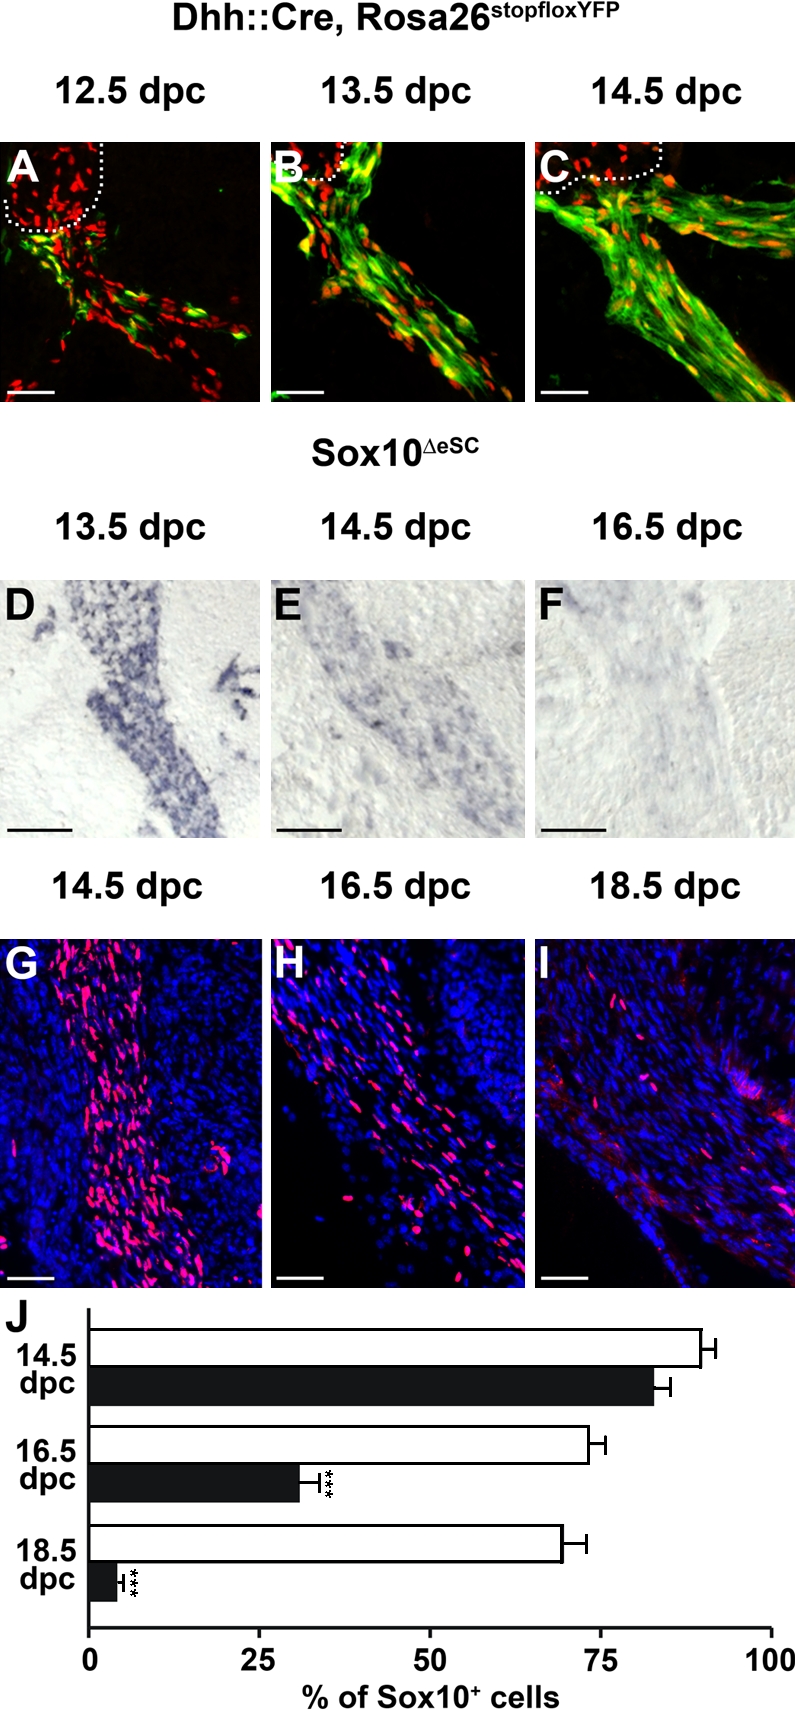
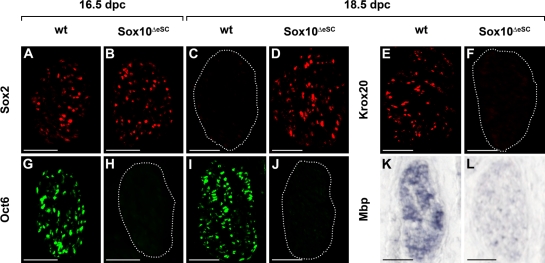
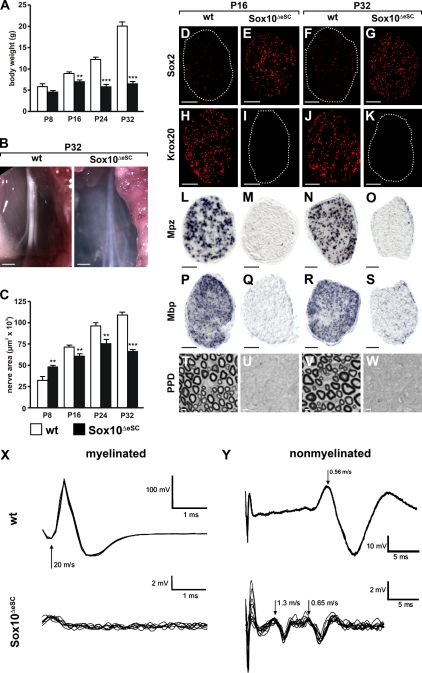
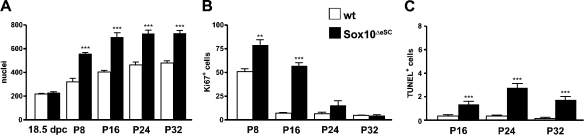
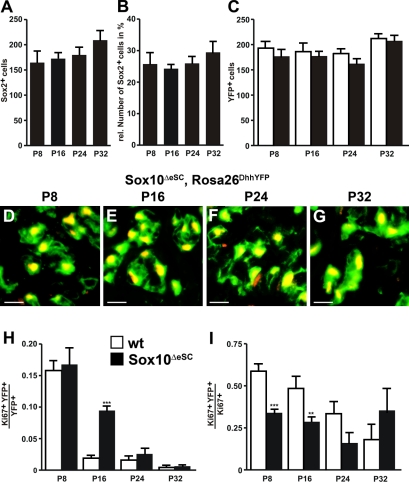
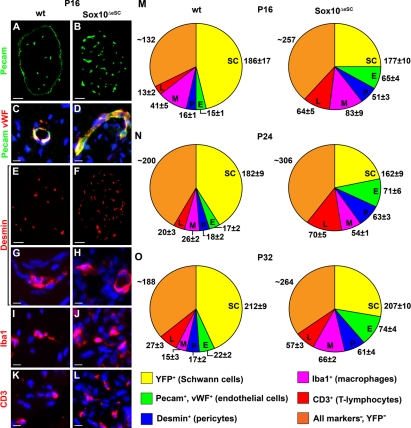
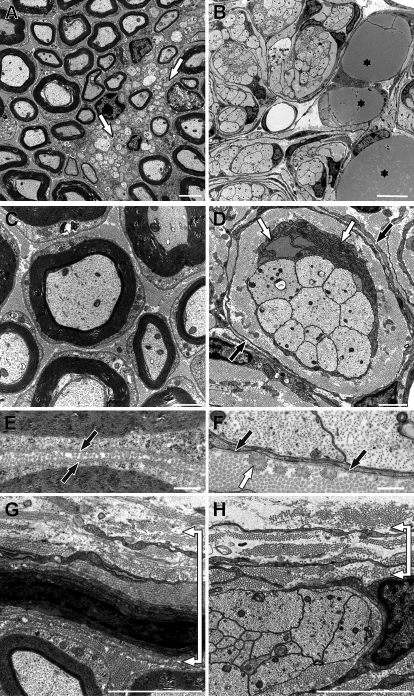
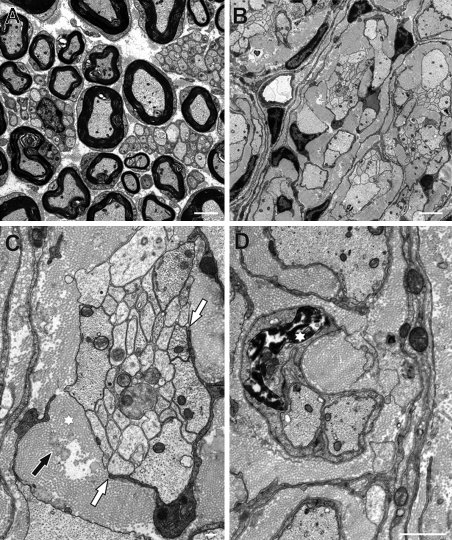
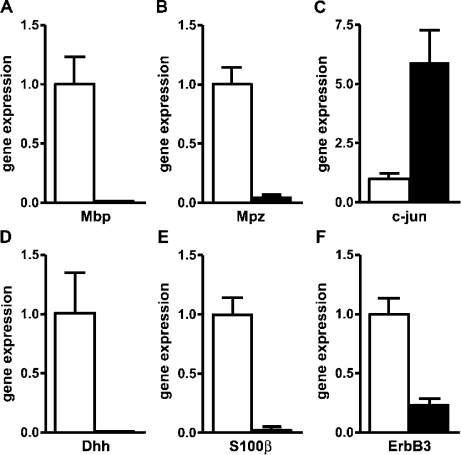
Mutations in the transcription factor SOX10 cause neurocristopathies, including Waardenburg-Hirschsprung syndrome and peripheral neuropathies in humans. This is partly attributed to a requirement for Sox10 in early neural crest for survival, maintenance of pluripotency, and specification to several cell lineages, including peripheral glia. As a consequence, peripheral glia are absent in Sox10-deficient mice. Intriguingly, Sox10 continues to be expressed in these cells after specification. To analyze glial functions after specification, we specifically deleted Sox10 in immature Schwann cells by conditional mutagenesis. Mutant mice died from peripheral neuropathy before the seventh postnatal week. Nerve alterations included a thinned perineurial sheath, increased lipid and collagen deposition, and a dramatically altered cellular composition. Nerve conduction was also grossly aberrant, and neither myelinating nor nonmyelinating Schwann cells formed. Instead, axons of different sizes remained unsorted in large bundles. Schwann cells failed to develop beyond the immature stage and were unable to maintain identity. Thus, our study identifies a novel cause for peripheral neuropathies in patients with SOX10 mutations.


Figures

Figure 1.
Figure 1.
Generation of a conditional Sox10 allele in mice. (A) Schematic representation, from top to bottom, of the targeting construct, the wild-type Sox10 allele (Sox10+), the conditional Sox10 allele before (Sox10flneo) and after (Sox10fl) removal of the neo selection cassette by Flp recombinase, and the deleted allele (Sox10Δ) after Cre recombination. Sox10 exons (I–V) and the continuous Sox10 ORF used in the conditional allele are shown as boxes, and 4.5- and 1.5-kb-long flanking regions are shown as bars. Regions of homology between wild-type locus and targeting vector are depicted as black bars, introns 3 and 4 are depicted as open bars, and surrounding genomic regions not contained in the targeting construct are depicted as dashed bars. Plasmid backbone sequences of the targeting construct are indicated by a thin line. Restriction sites for NcoI (N), BamHI (B), and ScaI (S) are shown as well as the localization of 5′ and 3′ probes and the start codon of the Sox10 gene (ATG). neo, neomycin resistance cassette; FRT, recognition sites for Flp recombinase (depicted as ellipses); loxP, recognition sites for Cre recombinase (depicted as triangles); Tk, Herpes simplex virus thymidine kinase gene cassette. (B) Southern blot analysis of genomic DNA from Sox10+/+ (wt) and Sox10fl/fl (fl/fl) mice digested with NcoI for use of the 5′ probe and BamHI–ScaI for the 3′ probe. The size of bands corresponding to the wild-type (6.6 kb for the 5′ probe and 4.6 kb for the 3′ probe) and the targeted alleles (4.8 kb for the 5′ probe and 3.7 kb for the 3′ probe) are indicated. (C) PCR genotyping of Sox10+/+ (wt), Sox10+/fl (+/fl), and Sox10fl/fl (fl/fl) mice. Size of DNA fragments in the marker (M) is indicated in kilobases on the left. (D) Whole mount GFP autofluorescence of Sox10fl/fl embryos at 10.5 dpc. (E) Immunohistochemistry with antibodies directed against Sox10 on transverse sections from the thoracic region of Sox10+/+ (wt) and Sox10fl/fl (fl/fl) embryos at 12.5 dpc. (F) Comparison of expression levels for Sox10 in Sox10+/+ (wt) and Sox10fl/fl (fl/fl) embryos at 12.5 dpc with primers recognizing a common sequence in both transcripts using quantitative LightCycler RT-PCR. Transcript levels in each sample were normalized to Rpl8. After normalization, transcript levels in the wild type were arbitrarily set to 1, and transcript levels in Sox10fl/fl are expressed relative to wild-type levels ± SEM. Experiments were repeated twice with material from two independently obtained embryos for each genotype and age. Bars: (D) 1 mm; (E) 100 µm.
Figure 2.
Figure 2.
Kinetics of Sox10 deletion in spinal nerves of Sox10ΔeSC embryos. (A–C) Cre activity in spinal nerves was monitored by YFP autofluorescence (green) on transverse sections of Dhh::Cre, Rosa26stopfloxYFP (Rosa26DhhYFP) embryos at 12.5 (A), 13.5 (B), and 14.5 dpc (C). Anti-Sox10 immunofluorescence (red) is shown for comparison. The border between peripheral nerve and dorsal root ganglion is indicated by a dotted line. (D–F) Loss of Sox10 transcripts in spinal nerves of Sox10ΔeSC embryos was determined by in situ hybridization on transverse sections at 13.5 (D), 14.5 (E), and 16.5 dpc (F) using a Sox10-specific antisense riboprobe. (G–I) Disappearance of Sox10 protein in spinal nerves of Sox10ΔeSC embryos was assessed by immunohistochemistry on transverse sections of Sox10ΔeSC embryos at 14.5 (G), 16.5 (H), and 18.5 dpc (I) using a Sox10-specific antibody (red), followed by DAPI staining of nuclei (blue). (A–I) Proximal regions of spinal nerves are shown. (J) The percentage of Sox10-positive nuclei in spinal nerves of wild-type (open bars) and Sox10ΔeSC (closed bars) embryos was quantified at 14.5, 16.5, and 18.5 dpc and is presented as mean ± SEM. At least 15 spinal nerves from two independent embryos were counted for both genotypes. Differences were statistically significant between wild type and Sox10ΔeSC mutant from 16.5 dpc onwards as determined by Student’s t test (***, P ≤ 0.001). Bars, 50 µm.
Figure 3.
Figure 3.
Expression of Schwann cell markers in peripheral nerves of Sox10ΔeSC embryos. (A–L) Immunohistochemistry (A–J) and in situ hybridizations (K and L) were performed on transverse sections of wild-type (wt; A, C, E, G, I, and K) and Sox10ΔeSC (B, D, F, H, J, and L) sciatic nerves at 16.5 (A, B, G, and H) and 18.5 dpc (C–F and I–L) using antibodies directed against Sox2 (A–D), Krox20 (E and F), Oct6 (G–J), and an antisense riboprobe for Mbp (K and L). (C, F, H, and J) Dotted lines indicate the circumference of the sciatic nerve. Bars, 50 µm.
Figure 4.
Figure 4.
Postnatal development of Sox10ΔeSC mice and their sciatic nerves. (A) Weight of wild-type (open bars) and age-matched Sox10ΔeSC (closed bars) mice was monitored at P8, P16, P24, and P32. Data are shown as means ± SEM (n ≥ 6 for each genotype). Statistically significant differences from wild-type controls were observed from P16 onwards (**, P ≤ 0.01; and ***, P ≤ 0.001 by Student’s t test). (B) Macroscopic appearance of P32 sciatic nerves from wild-type (wt) and Sox10ΔeSC mice. (C) Sciatic nerve thickness was quantified for wild-type and Sox10ΔeSC mice at P8, P16, P24, and P32 by determining the area on proximal nerve sections. At least 20 sections from three mice were used per genotype for quantification. Data are presented as mean ± SEM. Differences were statistically significant between wild type and Sox10ΔeSC mutant from P8 onwards as determined by Student’s t test (**, P ≤ 0.01; ***, P ≤ 0.001). (D–K) Immunohistochemistry was performed on sciatic nerve sections from wild-type (D, F, H, and J) and Sox10ΔeSC (E, G, I, and K) mice at P16 (D, E, H, and I) and P32 (F, G, J, and K) using antibodies directed against Sox2 (D–G) and Krox20 (H–K). (D, F, I, and K) Dotted lines indicate the circumference of the sciatic nerve. (L–S) In situ hybridization was performed on sciatic nerve sections from wild-type (L, N, P, and R) and Sox10ΔeSC (M, O, Q, and S) mice at P16 (L, M, P, and Q) and P32 (N, O, R, and S) using antisense riboprobes for Mpz (L–O) and Mbp (P–S). (T–W) Myelin sheaths were visualized by PPD staining of sciatic nerve sections from wild-type (T and V) and Sox10ΔeSC (U and W) mice at P16 (T and U) and P32 (V and W). (X and Y) Electrophysiology on sciatic nerves of Sox10ΔeSC mice. Compound action potentials were monopolarly recorded from isolated sciatic nerves of wild-type and Sox10ΔeSC mice (n = 2 each). Experiments were performed on both nerves of each animal with identical results within each genotype. Representative superimposed traces are presented for both genotypes showing fast nerve conduction along myelinated fibers (X) and slow conduction along nonmyelinated fibers (Y). The arrows point to components of different conduction velocities (meters/second). Bars: (B) 1 mm; (D–S) 50 µm; (T–W) 3 µm.
Figure 5.
Figure 5.
Proliferation and cell death in sciatic nerves of Sox10ΔeSC mice. (A) The total cell number in sciatic nerves was determined for wild-type and Sox10ΔeSC mice at 18.5 dpc, P8, P16, P24, and P32 by quantifying the DAPI-stained nuclei in proximal nerve sections. (B) Proliferative cells were counted in wild-type and Sox10ΔeSC sciatic nerves at P8, P16, P24, and P32 as Ki67-positive cells. (C) Cell death was measured by the number of TUNEL-positive cells in wild-type and Sox10ΔeSC sciatic nerves at P16, P24, and P32. For all quantifications, at least 20 sections from three mice were used per genotype. Data are presented as mean ± SEM. According to the Student’s t test, differences were statistically significant between wild type and Sox10ΔeSC mutant as indicated (**, P ≤ 0.01; ***, P ≤ 0.001).
Figure 6.
Figure 6.
Schwann cell proliferation in sciatic nerves of Sox10ΔeSC mice. (A and B) The absolute number of Sox2-positive cells was determined in sciatic nerves of Sox10ΔeSC mice at P8, P16, P24, and P32 (A) and set in relation to the total number of cells (B). (C) Cell numbers were also determined for YFP-expressing cells in sciatic nerves of Dhh::Cre, Rosa26stopfloxYFP (Rosa26DhhYFP; open bars) and Dhh::Cre, Sox10fl/fl, Rosa26stopfloxYFP mice (Sox10ΔeSC, Rosa26DhhYFP; closed bars) at P8, P16, P24, and P32. (D–G) Coimmunohistochemistry was performed on sciatic nerve sections of Sox10ΔeSC, Rosa26DhhYFP mice at P8 (D), P16 (E), P24 (F), and P32 (G) using antibodies against Sox2 (red) and YFP (green). (H) Proliferation rates of wild-type (wt) and Sox10ΔeSC Schwann cells were determined at P8, P16, P24, and P32 by determining the fraction of Ki67-positive cells among the YFP-labeled cells in Rosa26DhhYFP (open bars) and Sox10ΔeSC, Rosa26DhhYFP mice (closed bars). (I) The proliferation rates of Sox10ΔeSC Schwann cells (see H) were also used to determine the relative contribution of Schwann cells to the overall proliferation in sciatic nerves of Sox10ΔeSC mice. For all quantifications, at least 20 sections from three mice were used per genotype. Data are presented as mean ± SEM. According to the Student’s t test, differences were statistically significant between wild type and Sox10ΔeSC mutant as indicated (**, P ≤ 0.01; ***, P ≤ 0.001). Bars, 10 µm.
Figure 7.
Figure 7.
Cellular composition of sciatic nerves in Sox10ΔeSC mice. (A–L) Immunohistochemistry was performed on sciatic nerve sections from wild-type (wt; A, C, E, G, I, and K) and Sox10ΔeSC (B, D, F, H, J, and L) mice at P16 using antibodies directed against Pecam (A–D) and von Willebrand factor (vWF; C and D) as predominantly endothelial markers, desmin (E–H) as a marker for pericytes, Iba1 (I and J) as a marker for macrophages, and CD3 (K and L) as a marker for T lymphocytes and is shown in low (A, B, E, and F) and high (C, D, and G–L) magnification. All markers are in red except Pecam, to which green color was assigned. Nuclei in C, D, and G–L were counterstained by DAPI (blue). (M–O) These and analogous experiments at other time points were used to determine the cellular composition of sciatic nerves in wild-type and Sox10ΔeSC mice at P16 (M), P24 (N), and P32 (O). Quantifications were performed on at least 20 sections from three mice per genotype. Cell numbers are presented as mean ± SEM. Bars: (A, B, E, and F) 50 µm; (C, D, and G–L) 10 µm.
Figure 8.
Figure 8.
Sciatic nerve ultrastructure in Sox10ΔeSC mice at P16. (A–H) Myelin sheaths and Remak bundles (white arrows in A) were only present in wild-type nerves (A, C, E, and G), whereas large- and small-caliber axons were jointly surrounded by a single Schwann cell in nerves of Sox10ΔeSC mice (B, D, F, and H). Collagen and elastic fibers were densely layered around each group of axons and associated Schwann cell in mutant sciatic nerves, again surrounded in an onion skin style by flat cells with long cytoplasmic processes (black arrows in D). Adipocytes with lipid inclusions (asterisks in B) were present in mutant sciatic nerves and Schwann cells frequently had an enlarged rough endoplasmic reticulum (white arrows in D). Axons in mutant and wild-type sciatic nerves looked similar. Myelin sheaths in wild-type nerves were surrounded by a complete basal lamina (black arrows in E). In contrast, in nerves of Sox10ΔeSC mice the basal lamina of Schwann cells was considerably thinner and often incomplete (black arrows in F). In addition, elastic fibers (white arrow in F) were frequently observed in close contact with Schwann cells of mutant nerves but were essentially absent in wild-type nerves. The perineurial sheath was dramatically thicker in wild-type nerves (bracket in G) than in mutant nerves (bracket in H). Bars: (A) 2 µm; (B) 5 µm; (C and D) 1 µm; (E–H) 500 nm.
Figure 9.
Figure 9.
Sciatic nerve ultrastructure in Sox10ΔeSC mice at P32. (A) Myelinated axons and Remak bundles in wild-type sciatic nerves were separated by loose endoneural extracellular matrix. (B) In mutant nerves, axon bundles and their associated Schwann cells were separated from other units by a dense fibrillar extracellular matrix. (C) Axon bundles in mutant nerves were frequently not completely covered by a Schwann cell and its processes (white arrows) but in direct contact to the surrounding extracellular matrix which contains collagen fibrils (black arrow) and elastic fibers (asterisk). (D) Several Schwann cells in mutant sciatic nerves show condensed and fragmented chromatin (asterisk), strongly indicating apoptotic cell death. Bars: (A and B) 2.5 µm; (C) 250 nm; (D) 1 µm.
Figure 10.
Figure 10.
Gene expression experiments on sciatic nerves of Sox10ΔeSC mice. (A–F) Quantitative RT-PCR was performed on cDNA prepared from P16 sciatic nerves of wild-type (open bars) and Sox10ΔeSC (closed bars) mice using primers directed against Mbp (A), Mpz (B), c-Jun (C), Dhh (D), S100-β (E), and ErbB3 (F). Transcript levels in each sample were normalized to Rpl8. After normalization, transcript levels in the wild type were arbitrarily set to 1, and transcript levels in Sox10ΔeSC mice are expressed relative to wild-type levels ± SEM. Experiments were repeated twice with material from two independent sciatic nerve preparations for each genotype.

Similar articles

Cited by

References

    1. Barbaria E.M., Kohl B., Buhren B.A., Hasenpusch-Theil K., Kruse F., Küry P., Martini R., Müller H.W. 2009. The alpha-chemokine CXCL14 is up-regulated in the sciatic nerve of a mouse model of Charcot-Marie-Tooth disease type 1A and alters myelin gene expression in cultured Schwann cells. Neurobiol. Dis. 33:448–458 10.1016/j.nbd.2008.11.014 - DOI - PubMed
    1. Benninger Y., Thurnherr T., Pereira J.A., Krause S., Wu X., Chrostek-Grashoff A., Herzog D., Nave K.A., Franklin R.J., Meijer D., et al. 2007. Essential and distinct roles for cdc42 and rac1 in the regulation of Schwann cell biology during peripheral nervous system development. J. Cell Biol. 177:1051–1061 10.1083/jcb.200610108 - DOI - PMC - PubMed
    1. Berman M.E., Xie Y., Muller W.A. 1996. Roles of platelet/endothelial cell adhesion molecule-1 (PECAM-1, CD31) in natural killer cell transendothelial migration and beta 2 integrin activation. J. Immunol. 156:1515–1524 - PubMed
    1. Bermingham J.R., Jr, Scherer S.S., O’Connell S., Arroyo E., Kalla K.A., Powell F.L., Rosenfeld M.G. 1996. Tst-1/Oct-6/SCIP regulates a unique step in peripheral myelination and is required for normal respiration. Genes Dev. 10:1751–1762 10.1101/gad.10.14.1751 - DOI - PubMed
    1. Bondurand N., Dastot-Le Moal F., Stanchina L., Collot N., Baral V., Marlin S., Attie-Bitach T., Giurgea I., Skopinski L., Reardon W., et al. 2007. Deletions at the SOX10 gene locus cause Waardenburg syndrome types 2 and 4. Am. J. Hum. Genet. 81:1169–1185 10.1086/522090 - DOI - PMC - PubMed

Publication types

Substances