. 2010 May 17;189(4):691-700.
doi: 10.1083/jcb.200910119. Epub 2010 May 10.

Botulinum hemagglutinin disrupts the intercellular epithelial barrier by directly binding E-cadherin

Affiliations

Botulinum hemagglutinin disrupts the intercellular epithelial barrier by directly binding E-cadherin

Yo Sugawara et al. J Cell Biol. .

Abstract

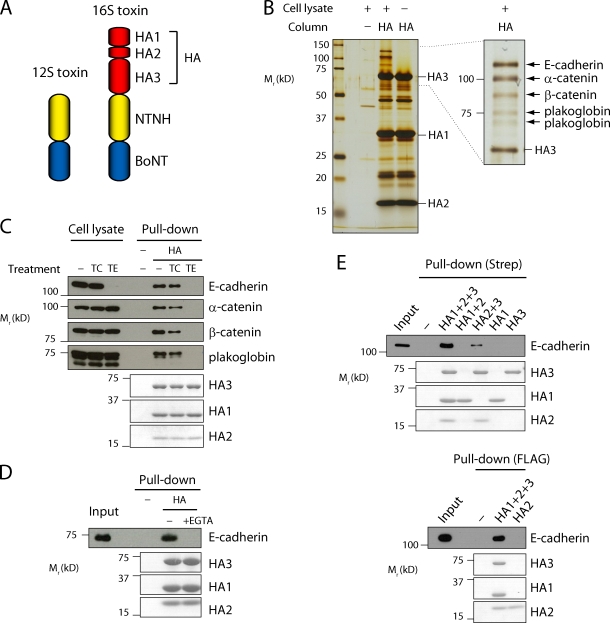
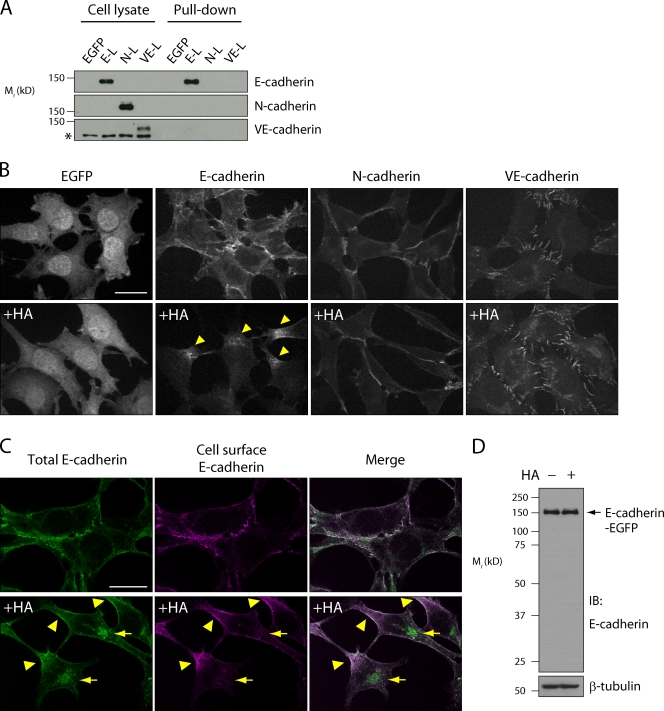
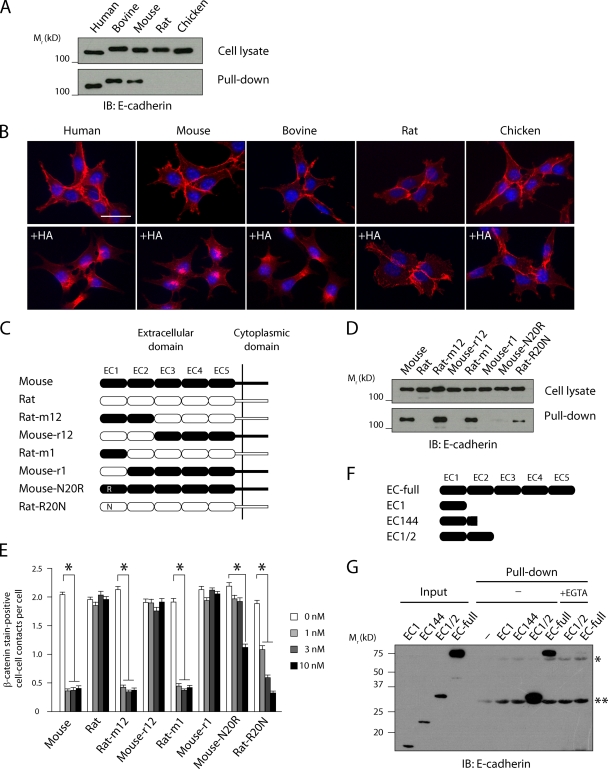
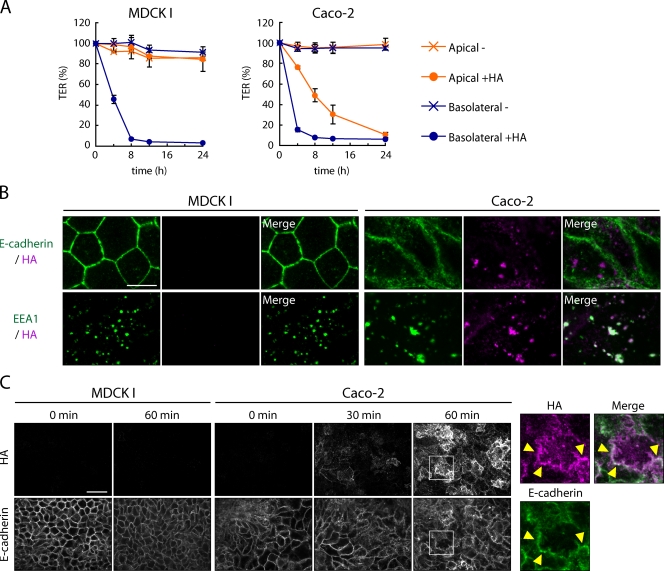
Botulinum neurotoxin is produced by Clostridium botulinum and forms large protein complexes through associations with nontoxic components. We recently found that hemagglutinin (HA), one of the nontoxic components, disrupts the intercellular epithelial barrier; however, the mechanism underlying this phenomenon is not known. In this study, we identified epithelial cadherin (E-cadherin) as a target molecule for HA. HA directly binds E-cadherin and disrupts E-cadherin-mediated cell to cell adhesion. Although HA binds human, bovine, and mouse E-cadherin, it does not bind rat or chicken E-cadherin homologues. HA does not interact with other members of the classical cadherin family such as neural and vascular endothelial cadherin. Expression of rat E-cadherin but not mouse rescues Madin-Darby canine kidney cells from HA-induced tight junction (TJ) disruptions. These data demonstrate that botulinum HA directly binds E-cadherin and disrupts E-cadherin-mediated cell to cell adhesion in a species-specific manner and that the HA-E-cadherin interaction is essential for the disruption of TJ function.


Figures

Figure 1.
Figure 1.
Botulinum HA binds to E-cadherin. (A) Schematic representation of the BoNT complexes. (B) Purification of HA binding proteins. Caco-2 cell lysates were loaded on a Strep-Tactin column prebound with HA. As a control, cell lysates were passed over a bare Strep-Tactin column, or a buffer was passed over a column containing HA. HA and associated proteins were eluted, and the eluates were further purified using anti-Flag M2 gel. HA and HA-binding proteins were eluted with low pH buffer (pH 3.5), separated by SDS-PAGE, and detected by silver stain (left). Alternatively, HA-binding proteins were eluted with EDTA and NaCl (right). Detected bands were excised and processed for mass spectrometric analysis, and the identified proteins are indicated (arrows). (C) Caco-2 cells were treated with trypsin in the presence of Ca2+ (TC) or EDTA (TE) before the extraction, and cell lysates were subjected to a HA pull-down assay followed by immunoblotting with antibodies for the indicated proteins. The HA proteins were detected by Coomassie blue stain. (D) The E-cadherin extracellular domain protein was pulled down with Strep-Tactin gel loaded with HA, but Ca2+ chelation by 5 mM EGTA prevented this interaction. (E) E-cadherin was pulled down from Caco-2 cell lysates with Strep-Tactin gel loaded with Strep-tagged HA1, Strep-tagged HA3, or the indicated combination of HA subunits (top). Flag-tagged HA2 was coupled to anti-Flag M2 gel and used for pull-down assay (bottom). HA1 and -2 do not form stable complexes.
Figure 2.
Figure 2.
Botulinum HA disrupts E-cadherin but not N-cadherin– and VE-cadherin–mediated cell adhesion. (A) Cell lysates prepared from L cells stably expressing EGFP, E-cadherin–EGFP (E-L), N-cadherin–EGFP (N-L), and VE-cadherin–EGFP (VE-L) were subjected to a HA pull-down assay followed by immunoblotting with specific antibodies for each protein. The asterisk denotes nonspecific bands. (B) Confocal images of EGFP fluorescence of the L cells pretreated with or without 100 nM HA for 6 h. E-cadherin–EGFP formed clusters (arrowheads). (C) E-L cells treated as in B were stained with the monoclonal antibody DECMA-1, which recognizes the extracellular region of E-cadherin (Ozawa et al., 1990), before permeabilization. After permeabilization, E-cadherin–EGFP was labeled with an anti–E-cadherin antibody that recognizes the intracellular domain of E-cadherin. E-cadherin–EGFP costained with these two antibodies is localized to the cell surface (arrowheads), and E-cadherin–EGFP stained only with the anti–intracellular domain antibody indicates internalized protein (arrows). (D) E-L cells treated as in B were lysed in SDS-PAGE sample buffer and analyzed by immunoblotting using anti–E-cadherin antibody. β-Tubulin was used as a loading control. IB, immunoblot. Bars, 20 µm.
Figure 3.
Figure 3.
E-cadherin EC1 and -2 domains are required for HA binding. (A) Human, mouse, and bovine but not rat and chicken E-cadherin bound HA. Cell lysates prepared from L cells stably expressing E-cadherin derived from each species were subjected to a HA pull-down assay followed by immunoblotting. (B) L cells were treated with or without 10 nM HA for 6 h, stained with an antibody against β-catenin (red) to demonstrate cadherin-dependent cell to cell boundary localization. Nuclei were stained with Hoechst (blue). (C) Schematic representation of E-cadherin chimeras between mouse (closed) and rat (open). (D) Cell lysates from the L cells expressing E-cadherin chimeras were subjected to a HA pull-down assay followed by immunoblotting. (E) The extent of the disruption of E-cadherin–mediated cell–cell adhesion was quantified as the mean number of β-catenin stain–positive cell–cell contacts per cell. A total of at least 250 cells were counted per condition in three independent experiments. Values are means ± SEM (*, P < 0.001). (F) Schematic representation of recombinant mouse EC domain proteins. (G) The recombinant EC domain proteins were subjected to a HA pull-down assay in the absence or presence of 5 mM EGTA followed by immunoblotting for E-cadherin. The asterisk and double asterisk denote HA3 and -1, respectively, which nonspecifically reacted with the antibody used. IB, immunoblot. Bar, 30 µm.
Figure 4.
Figure 4.
HA is transcytosed in Caco-2 cells. (A) Caco-2 and MDCK I cells were grown in Transwell chambers, and TER was measured in the presence (•) or absence (x) of HA applied to the apical (1 µM) or basolateral (100 nM) chamber. Values are means ± SEM (n = 3). (B) Caco-2 and MDCK I cell monolayers were apically treated with 100 nM HA for 30 min at 4°C. Cells were washed and incubated for an additional 30 min at 37°C. HA was labeled with E-cadherin or EEA1 using specific antibodies against each molecule. (C) Caco-2 and MDCK I cell monolayers were treated with 1 µM HA from the apical side for the indicated times. The basolateral surface was labeled with anti-HA antibody before permeabilization. After permeabilization, cells were labeled with anti–E-cadherin antibody. Right panels show a higher magnification image of the boxed region. Partial colocalization of HA (magenta) and E-cadherin (green) was observed (arrowheads). Bars: (B) 10 µm; (C) 30 µm.
Figure 5.
Figure 5.
The E-cadherin–HA interaction is critically involved in HA-mediated TJ disruption. (A) Cell lysates were prepared from MDCK I cells stably expressing EGFP, mouse E-cadherin–EGFP (Mouse-Ecad), or rat E-cadherin–EGFP (Rat-Ecad) and subjected to a HA pull-down assay followed by immunoblotting. Arrowheads and arrows denote E-cadherin–EGFP and endogenous canine E-cadherin, respectively. (B) MDCK transfectants were grown in Transwell chambers, and TER was measured in the presence (•) or absence (x) of 100 nM HA applied to the basolateral chamber. Values are means ± SEM (n = 3). (C) Confocal images of exogenous E-cadherin (EGFP), mouse and endogenous canine E-cadherin (DECMA-1), and HA of the cells treated with or without 100 nM HA for 24 h. Right panels show a higher magnification image of the boxed region. Endogenous E-cadherin (green) was cointernalized with HA (magenta; arrowheads). DECMA-1 recognizes mouse and canine but not rat E-cadherin. (D) Confocal images of ZO-1 of the cells treated with or without 100 nM HA for 24 h. Bars: (C) 10 µm; (D) 30 µm.

Similar articles

Cited by

References

    1. Arnon S.S., Schechter R., Inglesby T.V., Henderson D.A., Bartlett J.G., Ascher M.S., Eitzen E., Fine A.D., Hauer J., Layton M., et al. 2001. Botulinum toxin as a biological weapon: medical and public health management. JAMA. 285:1059–1070 10.1001/jama.285.8.1059 - DOI - PubMed
    1. Behrens J., Birchmeier W., Goodman S.L., Imhof B.A. 1985. Dissociation of Madin-Darby canine kidney epithelial cells by the monoclonal antibody anti-arc-1: mechanistic aspects and identification of the antigen as a component related to uvomorulin. J. Cell Biol. 101:1307–1315 10.1083/jcb.101.4.1307 - DOI - PMC - PubMed
    1. Boggon T.J., Murray J., Chappuis-Flament S., Wong E., Gumbiner B.M., Shapiro L. 2002. C-cadherin ectodomain structure and implications for cell adhesion mechanisms. Science. 296:1308–1313 10.1126/science.1071559 - DOI - PubMed
    1. Capaldo C.T., Macara I.G. 2007. Depletion of E-cadherin disrupts establishment but not maintenance of cell junctions in Madin-Darby canine kidney epithelial cells. Mol. Biol. Cell. 18:189–200 10.1091/mbc.E06-05-0471 - DOI - PMC - PubMed
    1. Citi S. 1993. The molecular organization of tight junctions. J. Cell Biol. 121:485–489 10.1083/jcb.121.3.485 - DOI - PMC - PubMed

Publication types