Review
. 2010 May 1;51 Suppl 1(Suppl 1):88S-101S.
doi: 10.2967/jnumed.109.068197.

Imaging myocardial metabolic remodeling

Affiliations
Review

Imaging myocardial metabolic remodeling

Robert J Gropler et al. J Nucl Med. .

Abstract

Myocardial metabolic remodeling is the process in which the heart loses its ability to utilize different substrates, becoming dependent primarily on the metabolism of a single substrate such as glucose or fatty acids for energy production. Myocardial metabolic remodeling is central to the pathogenesis of a variety of cardiac disease processes such as left ventricular hypertrophy, myocardial ischemia, and diabetic cardiomyopathy. As a consequence, there is a growing demand for accurate noninvasive imaging approaches of various aspects of myocardial substrate metabolism that can be performed in both humans and small-animal models of disease, facilitating the crosstalk between the bedside and the bench and leading to improved patient management paradigms. SPECT, PET, and MR spectroscopy are the most commonly used imaging techniques. Discussed in this review are the strengths and weaknesses of these various imaging methods and how they are furthering our understanding of the role of myocardial remodeling in cardiovascular disease. In addition, the role of ultrasound to detect the inflammatory response to myocardial ischemia will be discussed.


Figures

Figure 1
Figure 1
Simultaneous myocardial perfusion and metabolism imaging after dual intravenous injection of Tc-99m sestamibi and FDG at peak exercise. Dual isotope simultaneous acquisition was carried out 40–60 minutes after the exercise study was completed. Rest Tc-99m sestamibi imaging was carried out separately. In this patient with angina and no prior myocardial infarction, there is evidence for extensive reversible perfusion defect in the anterior, septal, and apical regions. The coronary angiogram showed 90% stenosis of the left anterior descending and 60% of the left circumflex coronary arteries. The corresponding FDG image show intense uptake in the regions with reversible sestamibi defects reflecting the metabolic correlate of exercise-induced myocardial ischemia. (Adapted from He et al [1]).
Figure 2
Figure 2
Single-photon emission CT showing delayed recovery of regional fatty acid metabolism after transient exercise-induced ischemia, termed ischemic memory. Representative stress (left) and rest reinjection (middle) short-axis thallium tomograms demonstrate a reversible inferior defect consistent with exercise- induced myocardial ischemia. A BMIPP-labeled CT (center) injected and acquired at rest 22 h after exercise-induced ischemia shows persistent metabolic abnormality in the inferior region despite complete recovery of regional perfusion at rest, as evidenced by thallium reinjection image. The tomogram on the far right shows retention of BMIPP in the heart of a normal adult for comparison. (Adapted from [15]). Abbreviation: BMIPP, β-methylp-[123I]-iodophenyl-pentadecanoic acid.
Figure 3
Figure 3
Example of hibernating myocardium. Images show a moderate perfusion defect involving the apex, mid to distal anterior and septal walls (superior row) but preserved FDG uptake; which allows delineation of hibernating myocardium in the distribution of the LAD territory (inferior row).
Figure 4
Figure 4
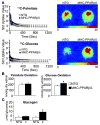
Increased myocardial glucose utilization in MHC-PPARβ/δ mice. A) Left: Standardized uptake value time-activity curves for 11C-palmitate and 11C-glucose into female MHC-PPARβ/δ–HE and NTG (non-transgenic) hearts as determined by micro-PET. Right: Representative micro-PET images at 20 sec after tracer injection. Images are normalized to total amount of radioactivity injected and body weight. The relative amounts of tracer uptake are indicated by the color scale. B) Oxidation of Palmitate and Glucose was assessed in isolated working hearts of 12-week-old male MHC-PPARβ/δ-HE and NTG control mice. Bars represent mean oxidation rates expressed as nanomoles substrate oxidized per gram dry mass per minute. C) Glycogen levels were assessed in mouse hearts from male MHC-PPARα-LE and MHCPPARβ/δ-HE mice and NTG controls. Results are presented as glucose released from glycogen and normalized to tissue weight. *P < 0.05 versus NTG [39] (permission pending).
Figure 5
Figure 5
Left: Cardiac Imaging in the mouse model. Right: Short Axis display of FDG myocardial uptake (60 minutes) in NTG (non-transgenic) and TG-mut (transgenic-mutant) of the PRKAG2 gene. It can be appreciated that FDG uptake in NTG is normal whereas in the TG-mut is significantly reduced. Below: Arterial blood (red) and myocardial (blue) time-activity curves. In the TG-mut, the myocardial curve shows lower rate of FDG uptake compared to that in NTG. With permission from MH Gollob and S Thorn.
Figure 6
Figure 6
A) Axial MR image of a patient with left ventricular hypertrophy and congestive heart failure with the region of localized 31P NMR spectra from chest and left ventricle identified (rectangular outline). B) 31P NMR spectra from chest muscle (bottom) and left ventricle (top) with control saturating RF irradiation (arrow). C) 31P NMR spectra from chest muscle (bottom) and left ventricle (top) with selective, saturating RF irradiation at the gamma-phosphate resonance (arrow). Note decreased magnitude of PCr signal in panel C due to chemical exchange with saturated 31P nuclei of the gamma phosphate of ATP. Decreased PCr signal depends on rate of ATP synthesis through the creatine kinase reaction. [51]
Figure 7
Figure 7
A) pseudo first-order rate constant (Kfor) for creatine kinase (CK) in hearts of healthy subjects (Normal), patients with left ventricular hypertrophy (LVH), and patients with LVH and congestive heart failure (LVH+CHF). B) ATP flux through CK in each group. Note depressed flux rate in LVH+CHF. [51]
Figure 7
Figure 7
A) pseudo first-order rate constant (Kfor) for creatine kinase (CK) in hearts of healthy subjects (Normal), patients with left ventricular hypertrophy (LVH), and patients with LVH and congestive heart failure (LVH+CHF). B) ATP flux through CK in each group. Note depressed flux rate in LVH+CHF. [51]
Figure 8
Figure 8
A) Sequential 13C NMR spectra (2 min each) of isolated rat heart oxidizing 13C enriched palmitate. Relative rates of isotope enrichment of glutamate 2-, 3-, and 4-carbons (GLU C-2, GLU C-3, GLU C-4) provide measures of oxidative rates. Progressive enrichment of triacylglyceride (TAG) provides TAG turnover. B) Selected 13C NMR spectra (2 min each) of isolated mouse heart, perfused with 13C palmitate, showing progressive enrichment of the TAG for measures of TAG turnover in transgenic models
Figure 9
Figure 9
In vivo 13C NMR spectra from heart of an anesthetized rat following bolus tail vein injection of 1 ml of 80 mM sodium [1-13C] pyruvate. A) Spectrum displaying 13C enriched metabolites of pyruvate. B) Sequential spectra acquired every second for 1 minute, post-injection. C) Time course of signals from pyruvate (solid circle), lactate (square), alanine (triangle) and bicarbonate (X). [62] Copyright 2007 by the National Academy of Sciences of the USA.
Figure 10
Figure 10
Localized 1H MRS signal from myocardial triacylglyceride in human. Left panel shows MR image of heart displaying localized volume within LV septum for MRS (yellow rectangle). Right panel displays 1H NMR spectrum with inset of expanded region of triacylglyceride signal (in red circle). [63]
Figure 11
Figure 11
Localized 1H MRS signals from myocardial triacylglyceride (TAG) of in vivo, anesthetized mouse heart at 14 T with localized volume of left ventricular septum for MRS indicated at right in the axial MR image of the heart (yellow box). Top panel displays signals from triacylglyceride within a 1 × 1 × 1 mm voxel. Bottom panel displayed enhanced signal from increased voxel size of 1 × 2 × 1 mm. From Dr. E. Douglas Lewandowski, Program in Integrative Cardiac Metabolism, UIC College of Medicine, Chicago, IL.
Figure 12
Figure 12
Schematic of vascular endothelium and approaches for ultrasound molecular imaging of inflammation during ischemia/reperfusion using microbubble attachment to endothelial cells. (A). Microbubbles bearing a targeting ligand on the surface can bind to a specific endothelial target, such as a leukocyte adhesion molecule. (B) Activated leukocytes may bind or phagocytose microbubbles and become acoustically active. Figure not drawn to scale.
Figure 13
Figure 13
Ultrasound ischemic memory imaging of myocardium using microbubbles targeted to bind to P-selectin via the tetrasaccharide sialyl Lewisx in a rat model of 15 minute coronary occlusion followed by reperfusion. Short axis non-linear ultrasound images of the heart are background subtracted, and degree of contrast enhancement is color-coded. (A) Injection of non-targeted microbubbles during coronary occlusion shows the risk area (region between arrows). (B) After reperfusion, non-targeted microbubble injection confirms restoration of myocardial perfusion. (C) Post mortem staining with triphenyl tetrazolium chloride indicates no infarction. (D) Delayed imaging after injection of control microbubbles during reperfusion demonstrates no persistent contrast enhancement. (E) Delayed imaging after injection of P-selectin targeted microbubbles during reperfusion shows persistent contrast enhancement in the region that was previously ischemic (risk area, Panel A). [81]
Figure 14
Figure 14
Inflammatory imaging of reperfused infarcted canine myocardium using phosphatidylserine-augmented lipid microbubbles which attach to activated leukocytes. Short axis non-linear ultrasound images are background subtracted and color-coded. (A) After injection of leukocyte-avid microbubbles during reperfusion, there is persistent contrast enhancement of the previously ischemic area. (B) Confirmation of leukocyte accumulation in the post-ischemic zone on autoradiography of isotope-labeled leukocytes. (C) TTC-stained myocardial specimen demonstrates non-transmural infarction. [87].

References

    1. He ZX, Shi RF, Wu YJ, Tian YQ, Liu XJ, Wang SW, Shen R, Qin XW, Gao RL, Narula J, Jain D. Direct imaging of exercise-induced myocardial ischemia with fluorine-18-labeled deoxyglucose and Tc-99m-sestamibi in coronary artery disease. Circulation. 2003;108:1208–1213. - PubMed
    1. Bergmann SR, Weinheimer CJ, Markham J, Herrero P. Quantitation of myocardial fatty acid metabolism using PET. J Nucl Med. 1996;37:1723–1730. - PubMed
    1. Herrero P, Dence CS, Coggan AR, Kisrieva-Ware Z, Eisenbeis P, Gropler RJ. L-3-11C-lactate as a PET tracer of myocardial lactate metabolism: a feasibility study. J Nucl Med. 2007;48:2046–2055. - PubMed
    1. Herrero P, Kisrieva-Ware Z, Dence CS, Patterson B, Coggan AR, Han DH, Ishii Y, Eisenbeis P, Gropler RJ. PET measurements of myocardial glucose metabolism with 1-11C-glucose and kinetic modeling. J Nucl Med. 2007;48:955–964. - PubMed
    1. Hudsmith LE, Neubauer S. Magnetic resonance spectroscopy in myocardial disease. JACC Cardiovasc Imaging. 2009;2:87–96. - PubMed

Publication types