

Activation of NMDA receptors is necessary for the recovery of cortical binocularity
- PMID: 20457852
- PMCID: PMC2867560
- DOI: 10.1152/jn.00442.2009
Activation of NMDA receptors is necessary for the recovery of cortical binocularity
Abstract
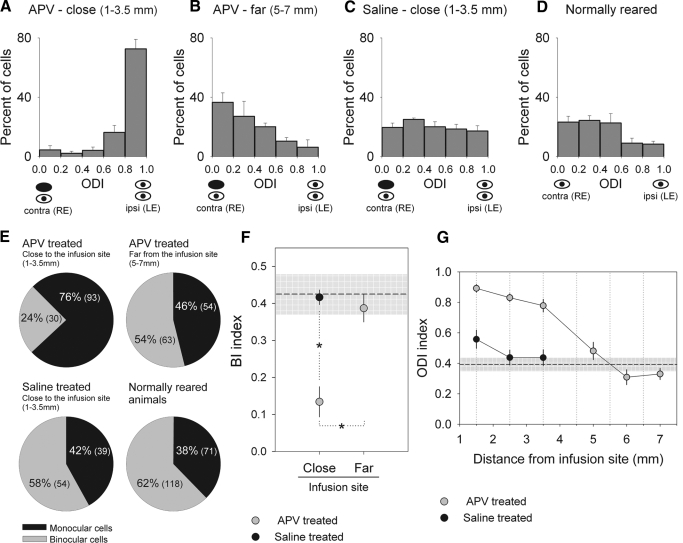
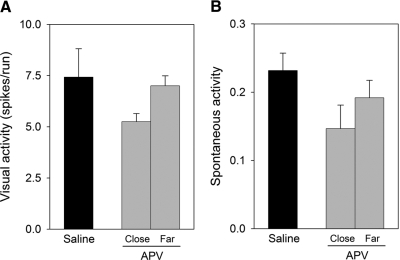
Classic experiments have indicated that monocular deprivation (MD) for a few days during a critical period of development results in a decrease in the strength of connections mediating responses to the deprived eye, leading to a dramatic breakdown of cortical neuron binocularity. Despite the substantial functional change in the visual cortex, recovery from the effects of MD can be obtained if binocular vision is promptly restored. While great efforts have been made to elucidate the mechanisms regulating loss of deprived eye function, the mechanisms that underlie the recovery of cortical binocularity are poorly understood. Here, we examined whether activation of the N-methyl-d-aspartate receptor (NMDAR) is required for the recovery of cortical binocularity by pharmacologically blocking the NMDAR using d,l-2-amino-5-phosphonopentanoic (APV). Ferrets (n = 10) were monocularly deprived for 6 days, and osmotic minipumps, filled with APV (5.6 mg/ml) or saline, were surgically implanted into the primary visual cortex. One day after surgery, the deprived eye was reopened, and the animals were allowed 24 h of binocular vision. Extracellular recordings showed that intracortical infusion of the NMDAR antagonist, APV, prevented recovery of cortical binocularity while preserving neuronal responsiveness. These findings provide an important new insight for a specific role of NMDARs in the recovery of cortical binocularity from the effects of MD.
Figures
Similar articles
-
Recovery of cortical binocularity and orientation selectivity after the critical period for ocular dominance plasticity.J Neurophysiol. 2004 Oct;92(4):2113-21. doi: 10.1152/jn.00266.2004. Epub 2004 Apr 21. J Neurophysiol. 2004. PMID: 15102897
-
Recovery from effects of brief monocular deprivation in the kitten.J Neurophysiol. 1984 Mar;51(3):538-51. doi: 10.1152/jn.1984.51.3.538. J Neurophysiol. 1984. PMID: 6699677
-
Different mechanisms for loss and recovery of binocularity in the visual cortex.J Neurosci. 2002 Oct 15;22(20):9015-23. doi: 10.1523/JNEUROSCI.22-20-09015.2002. J Neurosci. 2002. PMID: 12388608 Free PMC article.
-
Binocular Disparity Selectivity Weakened after Monocular Deprivation in Mouse V1.J Neurosci. 2017 Jul 5;37(27):6517-6526. doi: 10.1523/JNEUROSCI.1193-16.2017. Epub 2017 Jun 2. J Neurosci. 2017. PMID: 28576937 Free PMC article.
-
The deafferented visual cortex and interhemispheric relationships: a physiological approach.Metab Pediatr Syst Ophthalmol (1985). 1988;11(1-2):100-10. Metab Pediatr Syst Ophthalmol (1985). 1988. PMID: 3076606 Review.
Cited by
-
Visual Neuropsychology in Development: Anatomo-Functional Brain Mechanisms of Action/Perception Binding in Health and Disease.Front Hum Neurosci. 2021 May 31;15:689912. doi: 10.3389/fnhum.2021.689912. eCollection 2021. Front Hum Neurosci. 2021. PMID: 34135745 Free PMC article. Review.
-
Effects of developmental alcohol exposure on cortical multisensory integration.Eur J Neurosci. 2023 Mar;57(5):784-795. doi: 10.1111/ejn.15907. Epub 2023 Jan 24. Eur J Neurosci. 2023. PMID: 36610022 Free PMC article.
-
Binocular form deprivation influences the visual cortex.Neural Regen Res. 2012 Dec 5;7(34):2713-8. doi: 10.3969/j.issn.1673-5374.2012.34.009. Neural Regen Res. 2012. PMID: 25337118 Free PMC article.
-
Effects of developmental alcohol and valproic acid exposure on play behavior of ferrets.Int J Dev Neurosci. 2016 Aug;52:75-81. doi: 10.1016/j.ijdevneu.2016.03.007. Epub 2016 May 18. Int J Dev Neurosci. 2016. PMID: 27208641 Free PMC article.
-
D-Serine and Glycine Differentially Control Neurotransmission during Visual Cortex Critical Period.PLoS One. 2016 Mar 22;11(3):e0151233. doi: 10.1371/journal.pone.0151233. eCollection 2016. PLoS One. 2016. PMID: 27003418 Free PMC article.
References
-
- Artola A, Singer W. Long-term potentiation and NMDA receptors in rat visual cortex. Nature 330: 649–652, 1987. - PubMed
-
- Bliss TV, Collingridge GL. A synaptic model of memory: long-term potentiation in the hippocampus. Nature 361: 31–39, 1993. - PubMed
-
- Bourne HR, Nicoll R. Molecular machines integrate coincident synaptic signals. Cell 72: 65–75, 1993. - PubMed
-
- Chen WS, Bear MF. Activity-dependent regulation of NR2B translation contributes to metaplasticity in mouse visual cortex. Neuropharmacology 52: 200–214, 2007. - PubMed
Publication types
MeSH terms
Substances
Grants and funding
LinkOut - more resources
Full Text Sources
Other Literature Sources