. 2010 May;103(5):2757-69.
doi: 10.1152/jn.00987.2009. Epub 2010 Mar 24.

Retinal synaptic pathways underlying the response of the rabbit local edge detector

Affiliations

Retinal synaptic pathways underlying the response of the rabbit local edge detector

Thomas L Russell et al. J Neurophysiol. 2010 May.

Abstract

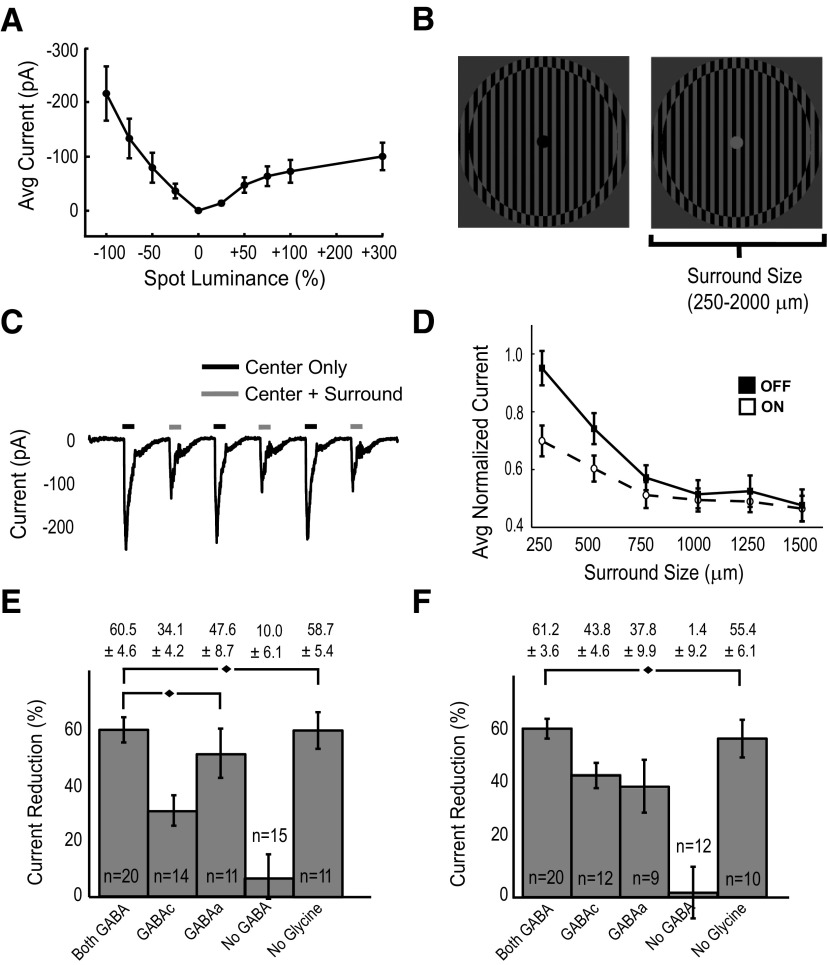
We studied the circuitry that underlies the behavior of the local edge detector (LED) retinal ganglion cell in rabbit by measuring the spatial and temporal properties of excitatory and inhibitory currents under whole cell voltage clamp. Previous work showed that LED excitation is suppressed by activity in the surround. However, the contributions of outer and inner retina to this characteristic and the neurotransmitters used are currently unknown. Blockage of retinal inhibitory pathways (GABA(A), GABA(C), and glycine) eliminated edge selectivity. Inverting gratings in the surround with 50-microm stripe sizes did not stimulate horizontal cells, but suppressed on and off excitation by roughly 60%, indicating inhibition of bipolar terminals (feedback inhibition). On pharmacologic blockage, we showed that feedback inhibition used both GABA(A) and GABA(C) receptors, but not glycine. Glycinergic inhibition suppressed GABAergic feedback inhibition in the center, enabling larger excitatory currents in response to luminance changes. Excitation, feedback inhibition, and direct (feedforward) inhibition responded to luminance-neutral flipping gratings of 20- to 50-microm widths, showing they are driven by independent subunits within their receptive fields, which confers sensitivity to borders between areas of texture and nontexture. Feedforward inhibition was glycinergic, its rise time was faster than decay time, and did not function to delay spiking at the onset of a stimulus. Both the on and off phases could be triggered by luminance shifts as short in duration as 33 ms and could be triggered during scenes that already produced a high baseline level of feedforward inhibition. Our results show how LED circuitry can use subreceptive field sensitivity to detect visual edges via the interaction between excitation and feedback inhibition and also respond to rapid luminance shifts within a rapidly changing scene by producing feedforward inhibition.


Figures

Fig. 1.
Fig. 1.
Feedback inhibition enhances the excitatory current profile representing an edge. A: dark gray square represents the edge of a 600 × 600 μm dark (−100% luminance) square against a gray background as it is flashed at different positions with respect to the cell dendritic field shown in the dashed circle. Stimulus position is shown at 5 key locations with respect to the dendritic field. Traces show the average excitatory currents for each position under control (n = 29) and with all inhibition blocked (γ-aminobutyric acid types A and C [GABAA and GABAC, respectively] and glycine, n = 5). Gray bar in each recording indicates the 1 s duration of the flash. Location intervals are spaced at 30 μm. The ratio of currents for 2 indicated stimulus positions is calculated. B: profile excitatory current measurements for 21 stimulus positions under control and with all inhibition blocked. Offset of square (relative to perfect centering at 0 μm) is indicated on the x-axis. Large gray square indicates locations where the dendritic field of the cell is located inside the square.
Fig. 2.
Fig. 2.
Spatial tuning of surround antagonism under control and inhibitory block. A: stimuli used for B and C. Left: 150-μm off (−100% luminance) spot used to stimulate only the excitatory center. Right: 2,000-μm off spot used to stimulate both center excitation and antagonistic surround. B: average excitatory current recordings in response to large and small spot under control (n = 10) and with all inhibitory receptors blocked in (GABAA, GABAC, and strychnine, n = 10). C: normalized average currents for each pharmacologic condition. Values are derived by dividing the 2,000-μm average spot currents by 150-μm average spot currents. Error bars = SE, n = 10 for both conditions. D: grating stimuli used for E. All consist of luminance-neutral stripes, of widths from 50 to 800 μm. All contain a 150-μm off spot in the center to drive excitation. Stripe polarity is inverted at 2 Hz for 3 s. E: normalized average currents recorded in response to stimuli in D. Values are derived by dividing the average currents in response to stripe-containing stimuli by a 150-μm off spot flashed for the same duration. Error bars = SE, n = 10 for both pharmacologic conditions.
Fig. 3.
Fig. 3.
Luminance response, inhibitory receptive field size, and pharmacology of presynaptic inhibition. A: average current recordings in response to 200-μm spots of varying luminance levels from −100% to +300%. Error bars = SE, n = 10. B: stimuli used in C–F. The center 150 μm was either solid on (+300% luminance) or off (−100% luminance). All stripes were 50 μm and inverted luminance polarity at 2 Hz for 3 s. The area that was inverted could be varied (from 250 to 1,500 μm for D, or the entire 2,000 μm for C, E, and F). C: an example excitatory current trace (for an off center spot) in response to center only (spot) stimulation vs. center plus surround (spot plus inverting gratings) stimulation. D: average normalized excitatory current of off and on center spot stimulation for increasing areas of inverting gratings in the surround. All current levels were normalized against a solid 150-μm center spot. Error bars = SE, n = 17 for the off system, n = 20 for the on system. E and F: average excitatory current reduction of center spot stimulation when full-field inverting gratings are used in the surround for the off spot (E) or for the on spot (F). Bars represent the percentage of this reduction under various pharmacologic conditions, labeled by which receptor system(s) remains intact after pharmacologic blockage. Error bars = SE, n values as indicated for each condition. All condition values that are nonsignificant relative to control are indicated with a ♦.
Fig. 4.
Fig. 4.
Effect of pharmacologic blockage on excitatory currents elicited by spots in the center. A: average excitatory recordings for off (−100% luminance) and on (+300% luminance) spots (200 μm) under control (n = 11) and GABA receptor blockage (n = 10). B: average current magnitudes for off spots and on spots under control and GABA receptor blockage. Error bars = SE, n as indicated. Significant differences are indicated with an asterisk (*). C: average excitatory currents for off and on spots (200 μm) under control (n = 19), strychnine (n = 13), and all inhibition blocked (n = 16). D: average current magnitudes for off and on spots (200 μm) under control, strychnine, and all inhibition blocked. Error bars = SE, n as indicated. Significant differences are indicated with *.
Fig. 5.
Fig. 5.
Local edge detector (LED) receptive field subunits. A: example of the stimulus presented. The stripe width varied from 10 to 70 μm and each was inverted at 2 Hz for 3 s against a gray background, followed by a 10-s pause. B and C: an example (B) excitatory current recording and (C) feedforward inhibitory recording in response to the series of stimuli of increasing strip width (A). Response magnitude is indicated by the scale on the left of the traces and average current in response to each stripe width (overlayed gray curve, scale right). Error bars = SE, n = 10 for both B and C. D: average spike rate in response to stimuli presented in A, n = 8.
Fig. 6.
Fig. 6.
Excitatory response to a drifting striped edge. A: illustration of stimulus position (600 × 600-μm luminance-neutral striped square against a gray background containing 50-μm stripes, drifted vertically at 2 Hz) relative to LED dendritic field (dashed circle) for 5 key horizontal locations. Location intervals are spaced at 30 μm. The ratio of currents for 2 indicated stimulus positions is calculated below. B: profile of excitatory current and spike count measurements for 21 stimulus positions. Offset of square (relative to perfect centering at 0 μm) is indicated on the x-axis. Gray square indicates locations where the dendritic field of the cell is located inside the drifted square. n = 15 for both excitation and spiking.
Fig. 7.
Fig. 7.
Kinetics of glycinergic feedforward inhibition. A: pharmacology of feedforward inhibition. off (−100% luminance) and on (+300% luminance) spot (200 μm) recordings under control and 1 μM strychnine. B: average traces and time to half-maximum and half-life decay times for off and on feedforward inhibition. Time to half-maximum was calculated by first finding the half-maximum current value by subtracting the peak current from the baseline current and dividing by 2. The time to half-maximum was the earliest time the current crossed above this value in relation to the stimulus onset. Decay half-life was the earliest time the current crossed below this value in relation to the peak time; n = 6. C: average spiking, excitatory, and inhibitory responses to an off (−100% luminance, left) or on (+300% luminance) spot. Region represents 150 ms before stimulus onset to 250 ms after stimulus onset. Spike trace is an average of spike recordings; n = 15 for all recordings. D and E: average feedforward inhibitory currents in response to 33-, 67-, or 133-ms off (C) or on (D) flashes; n = 5.
Fig. 8.
Fig. 8.
Excitation, feedforward inhibition, and spiking in response to rapid luminance shifts. A: excitation, feedforward inhibition, and spiking, in response to a drifting grating containing 50-μm stripes in the center 150 μm of the receptive field. Duration of the drift is indicated with gray bar. B: stimuli used for C–F. Drifting grating is presented for the duration of the gray bar. One of the 4 indicated images is presented at the time represented by the dark or white bar. Presentation durations were 33, 67, or 133 ms. Line legend is shown for C–F. C–F: feedforward inhibition in response to stimuli indicated in B. Substantial inhibitory waves are indicated (*); n = 5 for narrow conditions, n = 7 for wide conditions.
Fig. 9.
Fig. 9.
LED circuit diagram. A: pathways mediating LED activity. a and b: on and off bipolar cells. c and d: on and off high resolution excitatory pathways to LED dendrites. e and f: high resolution on and off glycinergic feedforward pathways. g and h: high resolution, GABAA and GABAC feedback pathways to on and off bipolar cells. j and k: high resolution excitatory on and off inputs to on and off glycinergic narrow field amacrine cells. l and m: center glycinergic suppression of GABA feedback. Glutamatergic pathways: orange arrows; GABAergic pathways: blue lines; glycinergic pathways: green lines. B: model of summation of excitatory and inhibitory receptive fields. Excitatory bipolar input to the LED (orange) has a standard difference-of-Gaussian shape, reflecting horizontal cell antagonism of excitation. Feedback inhibition likely has a Gaussian shape, but with a “blank” region due to glycinergic inhibition in the center. Excitation and inhibition add together (black) to form the excitatory receptive field of the LED: a Gaussian with strong inhibitory lobes immediately outside of the excitatory center.

Similar articles

Cited by

References

    1. Baylor DA, Nunn BJ, Schnapf JL. The photocurrent, noise, and spectral sensitivity of rods of the monkey Macaca fasicularis. J Physiol 357: 575–607, 1984. - PMC - PubMed
    1. Berson DM, Pu M, Famiglietti EV. The zeta cell: a new ganglion cell type in cat retina. J Comp Neurol 399: 269–288, 1998. - PubMed
    1. Billups D, Attwell D. Control of intracellular chloride concentration and GABA response polarity in rat retinal ON bipolar cells. J Physiol 545: 183–198, 2002. - PMC - PubMed
    1. Caldwell JH, Daw NW. New properties of rabbit retinal ganglion cells. J Physiol 276: 257–276, 1978. - PMC - PubMed
    1. Caldwell JH, Daw NW, Hyatt HJ. Effects of picrotoxin and strychnine on rabbit retinal ganglion cells: lateral interaction for cells with more complex receptive fields. J Physiol 276: 277–298, 1978. - PMC - PubMed

Publication types

MeSH terms

LinkOut - more resources