

Systemic autoimmunity and defective Fas ligand secretion in the absence of the Wiskott-Aldrich syndrome protein
- PMID: 20457871
- PMCID: PMC2918330
- DOI: 10.1182/blood-2009-08-237560
Systemic autoimmunity and defective Fas ligand secretion in the absence of the Wiskott-Aldrich syndrome protein
Abstract
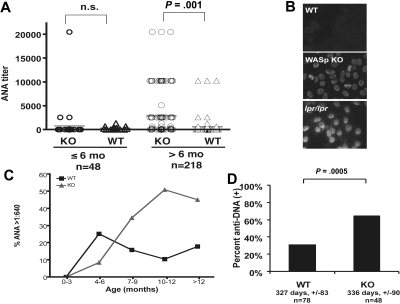
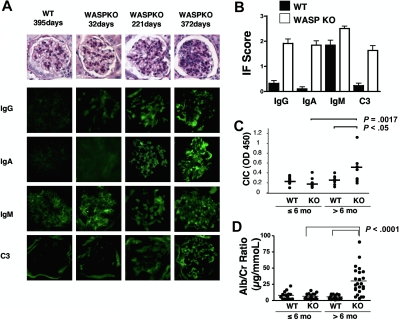
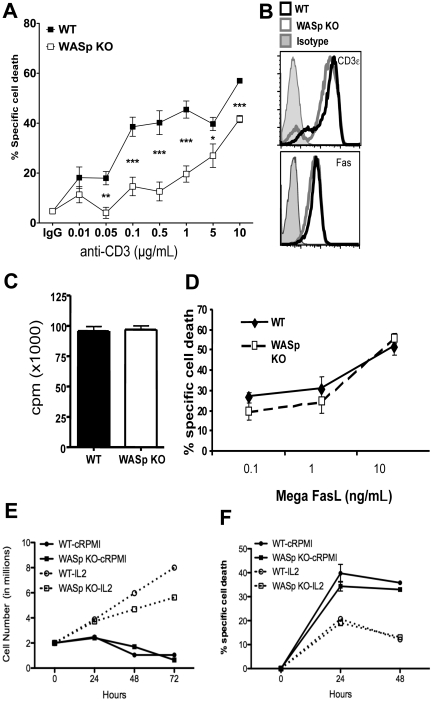
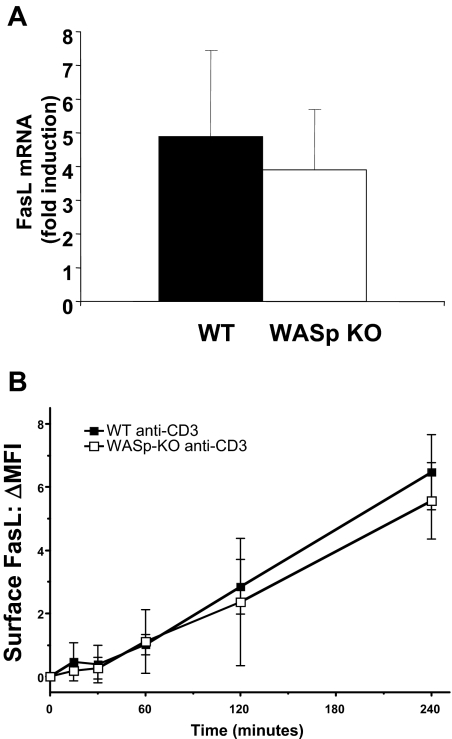
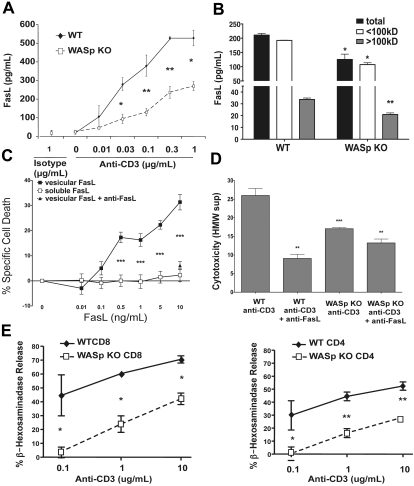
Autoimmunity is a surprisingly common complication of primary immunodeficiencies, yet the molecular mechanisms underlying this clinical observation are not well understood. One widely known example is provided by Wiskott-Aldrich syndrome (WAS), an X-linked primary immunodeficiency disorder caused by mutations in the gene encoding the WAS protein (WASp) with a high incidence of autoimmunity in affected patients. WASp deficiency affects T-cell antigen receptor (TCR) signaling and T-cell cytokine production, but its role in TCR-induced apoptosis, one of the mechanisms of peripheral immunologic tolerance, has not been investigated. We find that WASp-deficient mice produce autoantibodies and develop proliferative glomerulonephritis with immune complex deposition as they age. We also find that CD4(+) T lymphocytes from WASp-deficient mice undergo reduced apoptosis after restimulation through the TCR. While Fas-induced cell death is normal, WASp deficiency affects TCR-induced secretion of Fas ligand (FasL) and other components of secretory granules by CD4(+) T cells. These results describe a novel role of WASp in regulating TCR-induced apoptosis and FasL secretion and suggest that WASp-deficient mice provide a good model for the study of autoimmune manifestations of WAS and the development of more specific therapies for these complications.
Figures
Similar articles
-
Lymphocyte-dependent and Th2 cytokine-associated colitis in mice deficient in Wiskott-Aldrich syndrome protein.Gastroenterology. 2007 Oct;133(4):1188-97. doi: 10.1053/j.gastro.2007.07.010. Epub 2007 Jul 12. Gastroenterology. 2007. PMID: 17764675 Free PMC article.
-
Antigen receptor-induced activation and cytoskeletal rearrangement are impaired in Wiskott-Aldrich syndrome protein-deficient lymphocytes.J Exp Med. 1999 Nov 1;190(9):1329-42. doi: 10.1084/jem.190.9.1329. J Exp Med. 1999. PMID: 10544204 Free PMC article.
-
Wiskott-Aldrich Syndrome at the nexus of autoimmune and primary immunodeficiency diseases.FEBS Lett. 2011 Dec 1;585(23):3710-4. doi: 10.1016/j.febslet.2011.10.031. Epub 2011 Oct 25. FEBS Lett. 2011. PMID: 22036785 Free PMC article. Review.
-
Effects of Wiskott-Aldrich Syndrome Protein Deficiency on IL-10-Producing Regulatory B Cells in Humans and Mice.Scand J Immunol. 2015 Jun;81(6):483-93. doi: 10.1111/sji.12282. Scand J Immunol. 2015. PMID: 25728049
-
WASP-WIP complex in the molecular pathogenesis of Wiskott-Aldrich syndrome.Pediatr Int. 2016 Jan;58(1):4-7. doi: 10.1111/ped.12819. Epub 2015 Dec 5. Pediatr Int. 2016. PMID: 26331277 Review.
Cited by
-
H3K9 Trimethylation Silences Fas Expression To Confer Colon Carcinoma Immune Escape and 5-Fluorouracil Chemoresistance.J Immunol. 2015 Aug 15;195(4):1868-82. doi: 10.4049/jimmunol.1402243. Epub 2015 Jul 1. J Immunol. 2015. PMID: 26136424 Free PMC article.
-
Development of central nervous system autoimmunity is impaired in the absence of Wiskott-Aldrich syndrome protein.PLoS One. 2014 Jan 23;9(1):e86942. doi: 10.1371/journal.pone.0086942. eCollection 2014. PLoS One. 2014. PMID: 24466296 Free PMC article.
-
Comparative proteomics of exosomes secreted by tumoral Jurkat T cells and normal human T cell blasts unravels a potential tumorigenic role for valosin-containing protein.Oncotarget. 2016 May 17;7(20):29287-305. doi: 10.18632/oncotarget.8678. Oncotarget. 2016. PMID: 27086912 Free PMC article.
-
Role of Exosomes in the Regulation of T-cell Mediated Immune Responses and in Autoimmune Disease.Cells. 2019 Feb 12;8(2):154. doi: 10.3390/cells8020154. Cells. 2019. PMID: 30759880 Free PMC article. Review.
-
Exacerbated experimental arthritis in Wiskott-Aldrich syndrome protein deficiency: modulatory role of regulatory B cells.Eur J Immunol. 2014 Sep;44(9):2692-702. doi: 10.1002/eji.201344245. Epub 2014 Jul 15. Eur J Immunol. 2014. PMID: 24945741 Free PMC article. Clinical Trial.
References
-
- Bosticardo M, Marangoni F, Aiuti A, Villa A, Grazia Roncarolo M. Recent advances in understanding the pathophysiology of Wiskott-Aldrich syndrome. Blood. 2009;113(25):6288–6295. - PubMed
-
- Sullivan KE, Mullen CA, Blaese RM, Winkelstein JA. A multiinstitutional survey of the Wiskott-Aldrich syndrome. J Pediatr. 1994;125(6 Pt 1):876–885. - PubMed
-
- Dupuis-Girod S, Medioni J, Haddad E, et al. Autoimmunity in Wiskott-Aldrich syndrome: risk factors, clinical features, and outcome in a single-center cohort of 55 patients. Pediatrics. 2003;111(5 Pt 1):e622–627. - PubMed
-
- Schurman SH, Candotti F. Autoimmunity in Wiskott-Aldrich syndrome. Curr Opin Rheumatol. 2003;15(4):446–453. - PubMed
-
- Ozsahin H, Cavazzana-Calvo M, Notarangelo LD, et al. Long-term outcome following hematopoietic stem-cell transplantation in Wiskott-Aldrich syndrome: collaborative study of the European Society for Immunodeficiencies and European Group for Blood and Marrow Transplantation. Blood. 2008;111(1):439–445. - PubMed
Publication types
MeSH terms
Substances
Grants and funding
LinkOut - more resources
Full Text Sources
Medical
Molecular Biology Databases
Research Materials
Miscellaneous
