. 2010 Aug;185(4):1337-44.
doi: 10.1534/genetics.110.116681. Epub 2010 May 10.

Population structure with localized haplotype clusters

Affiliations

Population structure with localized haplotype clusters

Sharon R Browning et al. Genetics. 2010 Aug.

Abstract

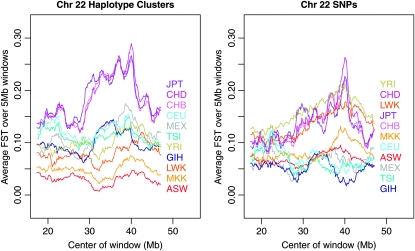
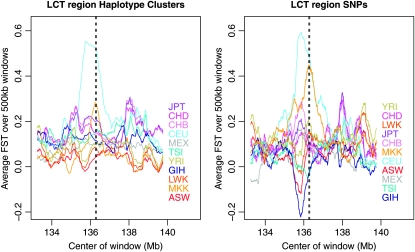
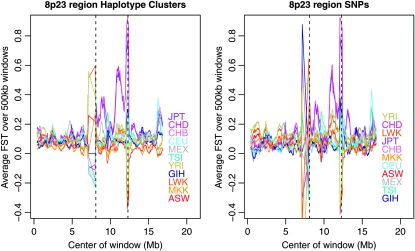
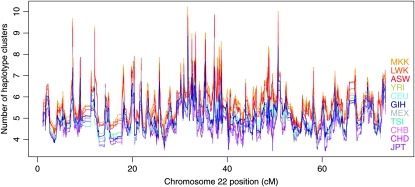
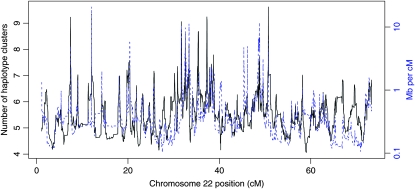
We propose a multilocus version of F(ST) and a measure of haplotype diversity using localized haplotype clusters. Specifically, we use haplotype clusters identified with BEAGLE, which is a program implementing a hidden Markov model for localized haplotype clustering and performing several functions including inference of haplotype phase. We apply this methodology to HapMap phase 3 data. With this haplotype-cluster approach, African populations have highest diversity and lowest divergence from the ancestral population, East Asian populations have lowest diversity and highest divergence, and other populations (European, Indian, and Mexican) have intermediate levels of diversity and divergence. These relationships accord with expectation based on other studies and accepted models of human history. In contrast, the population-specific F(ST) estimates obtained directly from single-nucleotide polymorphisms (SNPs) do not reflect such expected relationships. We show that ascertainment bias of SNPs has less impact on the proposed haplotype-cluster-based F(ST) than on the SNP-based version, which provides a potential explanation for these results. Thus, these new measures of F(ST) and haplotype-cluster diversity provide an important new tool for population genetic analysis of high-density SNP data.


Figures

F<sc>igure</sc> 1.—
Figure 1.—
Plot of haplotype clusters in the LCT gene for HapMap3 data. At every SNP the plot shows a series of rectangles, each representing a haplotype cluster, with lengths proportional to the number of haplotypes represented. The top rectangle in the key to the right of the plot shows the size of the rectangle that corresponds to 100 haplotypes. Within each rectangle, the length of each colored block is proportional to the number of haplotypes from the population with that color code. The colored rectangles in the key give the population labels. Population descriptions corresponding to the labels can be found in Table 1. The haplotype cluster model was built using a larger set of SNPs extending to either side of the gene, but only SNPs within the gene are shown. Supplementary Figure S1 gives a version of this figure with transition lines added.
F<sc>igure</sc> 2.—
Figure 2.—
Haplotype clusters in the LCT gene. Four haplotype clusters from the LCT gene are shown. These clusters correspond to haplotype clusters from Figure 1 and are all located at rs12988076 (the central SNP of the 23 SNPs shown). Cluster numbering is from the bottom of the graph in Figure 1 to the top, so cluster 1 is the bottom-most cluster, cluster 2 is the cluster above that, cluster 11 is the topmost cluster, and cluster 10 is the cluster one down from the top. Each 23-SNP haplotype seen within the four clusters is shown, along with a count of the number of times that it was seen. Within each cluster, variants differing between the majority haplotype and other observed haplotypes are shaded gray.
F<sc>igure</sc> 3.—
Figure 3.—
Sliding 5-Mb windows of population-specific FST on chromosome 22 for HapMap3 data. Estimates of population-specific FST were calculated using localized haplotype clusters from BEAGLE (left) or directly from SNPs (right). Each plotted line represents one population, with the corresponding population label having the same color. Population labels are ordered by averages over the whole of chromosome 22. Population descriptions corresponding to the labels can be found in Table 1.
F<sc>igure</sc> 4.—
Figure 4.—
Population-specific FST estimates in the region of LCT for HapMap3 data. The location of LCT is shown with a pair of dashed lines. Haplotype-cluster-based estimates are shown on the left, while estimates based on SNPs are on the right. In both cases, the estimates are from 500-kb windows.
F<sc>igure</sc> 5.—
Figure 5.—
Population-specific FST estimates in the region of the 8p23 inversion for HapMap3 data. The approximate breakpoints of the inversion are shown with dashed lines. Haplotype-cluster-based estimates are shown on the left, while estimates based on SNPs are on the right. In both cases, the estimates are from 500-kb windows.
F<sc>igure</sc> 6.—
Figure 6.—
Haplotype cluster diversity along chromosome 22 for sliding windows of 100 SNPs. Each plotted line represents one population, with the corresponding population label having the same color. Population labels are ordered by averages over the whole of chromosome 22 (see Table 1). Population descriptions corresponding to the labels can be found in Table 1.
F<sc>igure</sc> 7.—
Figure 7.—
Haplotype-cluster diversity for YRI and inverse of recombination rate. Values are plotted along chromosome 22 for sliding windows of 100 SNPs. The solid black line and left y-axis show haplotype-cluster diversity; the dashed blue line and right y-axis show inverse of recombination rate.

Similar articles

Cited by

References

    1. Antonacci, F., J. M. Kidd, T. Marques-Bonet, M. Ventura, P. Siswara et al., 2009. Characterization of six human disease-associated inversion polymorphisms. Hum. Mol. Genet. 18 2555–2566. - PMC - PubMed
    1. Auton, A., K. Bryc, A. R. Boyko, K. E. Lohmueller, J. Novembre et al., 2009. Global distribution of genomic diversity underscores rich complex history of continental human populations. Genome Res. 19 795–803. - PMC - PubMed
    1. Balding, D. J., 2006. A tutorial on statistical methods for population association studies. Nat. Rev. Genet. 7 781–791. - PubMed
    1. Browning, B. L., and S. R. Browning, 2007. a Efficient multilocus association testing for whole genome association studies using localized haplotype clustering. Genet. Epidemiol. 31 365–375. - PubMed
    1. Browning, B. L., and S. R. Browning, 2009. A unified approach to genotype imputation and haplotype-phase inference for large data sets of trios and unrelated individuals. Am. J. Hum. Genet. 84 210–223. - PMC - PubMed

Publication types