. 2010 May 25;107(21):9873-8.
doi: 10.1073/pnas.1003480107. Epub 2010 May 10.

N-cadherin-dependent neuron-neuron interaction is required for the maintenance of activity-induced dendrite growth

Affiliations

N-cadherin-dependent neuron-neuron interaction is required for the maintenance of activity-induced dendrite growth

Zhu-Jun Tan et al. Proc Natl Acad Sci U S A. .

Abstract

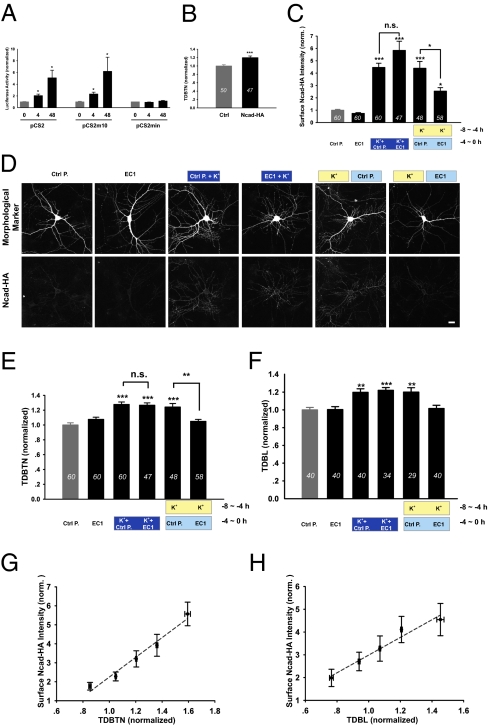
Formation of neural circuits depends on stable contacts between neuronal processes, mediated by interaction of cell adhesion molecules, including N-cadherin. In the present study, we found that activity-dependent dendrite arborization specifically requires N-cadherin-mediated extracellular neuron-neuron interaction, because the enhancement did not occur for neurons cultured in isolation or plated on an astrocyte monolayer and was abolished by a recombinant soluble N-cadherin ectodomain. Furthermore, depolarization elevated the level of membrane-associated cadherin/catenin complexes and surface N-cadherin. Importantly, surface N-cadherin elevation is specifically required for the maintenance of nascent dendrite arbors. Through loss- and gain-of-function approaches, we showed that N-cadherin-mediated dendrite growth requires association of the cadherin/catenin complex with the actin cytoskeleton. In summary, these results identify a previously unexplored and specific function for activity-induced, N-cadherin-mediated neuron-neuron contacts in the maintenance of dendrite arbors.


Conflict of interest statement

The authors declare no conflict of interest.

Figures

Fig. 1.
Fig. 1.
N-cadherin-mediated extracellular interaction is required for activity-dependent dendrite growth. (A) EC1 and full-length N-cadherin. EC, extracellular domain; ss, signal peptide; TM, transmembrane domain. (B) Immunoprecipitation (IP) of EC1-myc specifically from EC1-transfected neurons. Ctrl immunoblots (IB) show equivalent level of IgG in IP samples, and of tubulin in whole-cell samples. (C) Representative images of neurons transfected with GFP only (Ctrl) or EC1. (D) Cumulative probability distribution and quantitation of normalized TDBL for EC1 (0.71 ± 0.04, P < 0.001). (E) Cumulative probability distribution and quantitation of normalized TDBTN for EC1 (0.83 ± 0.02, P < 0.001). (F) Change in TDBTN consistent over 12 sister cultures. (G) Images of neurons incubated with EC1 protein, concentration/mL as indicated. (H) Quantitation of TDBTN: 0.2 μg EC1 (0.94 ± 0.03), 1 μg EC1 (0.81 ± 0.03, P < 0.001), 5 μg EC1 (0.80 ± 0.03, P < 0.001), BSA (0.99 ± 0.03), and b-EC1 (0.95 ± 0.03). (I) Quantitation of TDBL: 0.2 μg EC1 (0.99 ± 0.05), 1 μg EC1 (0.72 ± 0.04, P < 0.001), 5 μg EC1 (0.76 ± 0.05, P < 0.01), BSA (1.03 ± 0.04), and b-EC1 (1.03 ± 0.06). (J) Images of neurons incubated with K+ and EC1. (K) Quantitation of TDBTN: K+ (1.25 ± 0.04, P < 0.001), K+ + 0.2 μg EC1 (1.21 ± 0.03, P < 0.001), K+ + 1 μg EC1 (0.99 ± 0.04), K+ + 5 μg EC1 (0.79 ± 0.03, P < 0.001 vs. Ctrl, P < 0.001 vs. K+), and K+ + BSA (1.30 ± 0.03, P < 0.001). (L) Quantitation of TDBL: K+ (1.52 ± 0.08, P < 0.001), K+ + 0.2 μg EC1 (1.47 ± 0.07, P < 0.001), K+ + 1 μg EC1 (1.03 ± 0.04), K+ + 5 μg EC1 (0.70 ± 0.04, P < 0.01 vs. Ctrl, P < 0.001 vs. K+), and K+ + BSA (1.66 ± 0.06, P < 0.001). In this and all subsequent figures, number of neurons as indicated in bar graphs; more detailed quantitation is in Table S1. *P < 0.05, **P < 0.01, ***P < 0.001. (Scale bar, 20 μm.)
Fig. 2.
Fig. 2.
Requirement for neuron–neuron interaction in activity and N-cadherin-dependent dendrite growth. (A) Images of DIV 3 neurons plated at low density, with no contacting neighbors (MAP2 channel). (B) Quantitation of TDBTN: EC1 (1.11 ± 0.06), K+ (1.03 ± 0.04), and K+ + EC1 (1.05 ± 0.05). (C) Quantitation of TDBL: EC1 (1.06 ± 0.07), K+ (1.02 ± 0.05), and K+ + EC1 (1.04 ± 0.07). (D) Images of low-density neurons plated on astrocytes (weak background-like MAP2 staining). (E) Quantitation of TDBTN: EC1 (0.95 ± 0.04), K+ (0.99 ± 0.05), and K+ + EC1 (1.03 ± 0.05). (F) Quantitation of TDBL: EC1 (1.03 ± 0.06), K+ (1.02 ± 0.08), and K+ + EC1 (1.08 ± 0.06). (G) Images of neurons plated at high density. (H) Quantitation of TDBTN: EC1 (0.79 ± 0.05, P < 0.05), K+ (1.39 ± 0.07, P < 0.01), and K+ + EC1 (0.81 ± 0.04, P < 0.05). (I) Quantitation of TDBL: EC1 (0.69 ± 0.05, P < 0.05), K+ (1.47 ± 0.10, P < 0.001), and K+ + EC1 (0.68 ± 0.06, P < 0.05). (J and K) N-cadherin overexpression in low density cultures does not affect TDBTN (1.07 ± 0.06, P = 0.39) or TDBL (1.01 ± 0.06, P = 0.91). (L and M) N-cadherin overexpression in high density cultures significantly increased TDBTN (1.46 ± 0.07, P < 0.001) and TDBL (1.54 ± 0.11, P < 0.001). *P < 0.05, **P < 0.01. (Scale bars in A, D, and G, 20 μm.)
Fig. 3.
Fig. 3.
Interplay between the cadherin/catenin complex and actin dynamics during dendrite development. (A) Quantitation: Arp3-RNAi (0.75 ± 0.02), K+ (1.23 ± 0.03), K+ + Arp3-RNAi (0.75 ± 0.03), N-cad (1.23 ± 0.03), N-cad + Arp3-RNAi (0.74 ± 0.03), αN-cat (1.15 ± 0.03), αNcat + Arp3-RNAi (0.73 ± 0.03), h-Arp3 (1.25 ± 0.03), and h-Arp3 + Arp3-RNAi (1.25 ± 0.04). P < 0.01 or P < 0.001 for all conditions vs. Ctrl. (B) Quantitation: Arp3 (1.23 ± 0.03), Arp3 + EC1 (0.79 ± 0.03), WAVE2 (1.30 ± 0.04), WAVE2 + EC1 (0.81 ± 0.03), WASP (1.28 ± 0.03), WASP + EC1 (0.83 ± 0.03), VASP (1.22 ± 0.03), VASP + EC1 (0.78 ± 0.02), and EC1 alone (0.78 ± 0.01). P < 0.001 for all conditions vs. Ctrl. (C) Quantitation: Ncad-AD (1.33 ± 0.03), Ncad-RNAi (0.83 ± 0.02), Ncad-RNAi + Ncad-AD (1.22 ± 0.03), βcat-RNAi (0.85 ± 0.02), βcat-RNAi + Ncad-AD (1.26 ± 0.04), αNcat-RNAi (0.82 ± 0.03), αNcat-RNAi + Ncad-AD (1.43 ± 0.05), EC1 (0.81 ± 0.03), and EC1 + Ncad-AD (0.85 ± 0.03). P < 0.01 or P < 0.001 for all conditions vs. Ctrl. **P < 0.01; ***P < 0.001.
Fig. 4.
Fig. 4.
Neuronal activity increased surface and membrane levels of endogenous N-cadherin. (A) Blot of membrane N-cadherin following K+ treatment in culture. (B) Quantitation: 4 h K+ (1.87 ± 0.24, P < 0.05) and 48 h K+ (2.13 ± 0.28, P < 0.05). (C) Blot of membrane N-cadherin following KA injection in vivo. (D) Quantitation: 4 h KA (1.57 ± 0.12, P < 0.05) and 48 h KA (2.11 ± 0.41, P < 0.05). (E) Blot of surface biotinylated N-cadherin following K+ treatment. (F) Quantitation: 4 h K+ (2.31 ± 0.36, P < 0.05) and 48 h K+ (2.43 ± 0.46, P < 0.05). (G) Blot of whole-cell sample for E. (H) Quantitation: 4 h K+ (0.91 ± 0.08) and 48 h K+ (1.03 ± 0.04). Number of independent sample preparations as indicated in bar graphs. *P < 0.05.
Fig. 5.
Fig. 5.
Requirement of N-cadherin for the maintenance of activity-dependent dendrite growth. (A) Schematic of the paradigm used. (B) Images of neurons treated with K+. (Scale bar, 20 μm.) (C) Quantitation: “K+-pulse” (1.54 ± 0.04, P < 0.001) and “K+-chase” (1.53 ± 0.04, P < 0.001). (D) Quantitation for early-phase treatments: K+ (1.42 ± 0.03, P < 0.001), K+ + LatA (1.07 ± 0.03, P > 0.05 vs. Ctrl, P < 0.001 vs. K+), K+ + Jasp (1.02 ± 0.03, P > 0.05 vs. Ctrl, P < 0.001 vs. K+), K+ + EC1 (1.29 ± 0.04, P < 0.001), K+ + Ctrl P. (1.31 ± 0.04, P < 0.001), K+ + Ncad-Fc (1.33 ± 0.05, P < 0.001), and K+ + Ctrl A. (1.27 ± 0.04, P < 0.001). (E) Quantitation for late-phase treatments: K+ (1.34 ± 0.04, P < 0.001), EC1 (0.98 ± 0.03), K+ + EC1 (1.02 ± 0.02), Ctrl P. (0.94 ± 0.03), K+ + Ctrl P. (1.30 ± 0.04, P < 0.001), Ncad-Fc (0.95 ± 0.03), K+ + Ncad-Fc (1.00 ± 0.02), Ctrl A. (1.02 ± 0.04), and K+ + Ctrl A. (1.29 ± 0.03, P < 0.001). (F) Corresponding TDBL: K+ (1.13 ± 0.04, P < 0.05), K+ + EC1 (0.99 ± 0.03), K+ + Ctrl P. (1.15 ± 0.03, P < 0.01), K+ + Ncad-Fc (0.94 ± 0.03), and K+ + Ctrl A. (1.16 ± 0.03, P < 0.01). (G) Quantitation of TDBTN: K+-pulse (1.28 ± 0.03, P < 0.001), K+-chase (1.28 ± 0.02, P < 0.001), Ncad-RNAi (0.83 ± 0.02, P < 0.001), Ncad-RNAi + K+-pulse (1.09 ± 0.03), and Ncad-RNAi + K+-chase (0.94 ± 0.03). (H) Corresponding TDBL: K+-pulse (1.17 ± 0.03, P < 0.01), K+-chase (1.16 ± 0.04, P < 0.01), Ncad-RNAi (0.67 ± 0.03, P < 0.001), Ncad-RNAi + K+-pulse (0.81 ± 0.04, P < 0.01), and Ncad-RNAi + K+-chase (0.74 ± 0.03, P < 0.001). (I) Rate of dendrite extension in live imaging experiments for: Ctrl (212.8 ± 26.5) then K+ (390.6 ± 46.0, P < 0.001); Ctrl (166.4 ± 25.0) then “K+ + EC1” (394.7 ± 78.7, P < 0.01); K+ (240.8 ± 37.3) then Ctrl chase (132.0 ± 27.8, P < 0.05), and K+ (251.2 ± 28.1) then EC1 chase (105.3 ± 20.3, P < 0.01). (J) Corresponding rate of dendrite retraction for: Ctrl (114.3 ± 19.9) then K+ (93.0 ± 16.0, P = 0.29); Ctrl (82.8 ± 14.5) then “K+ + EC1” (79.6 ± 20.5, P = 0.87); K+ (90.5 ± 25.7) then Ctrl chase (89.2 ± 13.6, P = 0.96), and K+ (78.8 ± 19.1) then EC1 chase (242.7 ± 20.5, P < 0.001). *P < 0.05; **P < 0.01; ***P < 0.001.
Fig. 6.
Fig. 6.
Activity-induced increase in surface N-cadherin level depends on its extracellular interaction. (A) Luciferase activity for neurons transfected with pCS2 (4 h K+: 2.05 ± 0.03, P < 0.05; 48 h K+: 5.09 ± 1.30, P < 0.05), pCS2m10 (4 h K+: 2.34 ± 0.32, P < 0.05; 48 h K+: 6.19 ± 2.42, P < 0.05), or pCS2min (4 h K+: 0.92 ± 0.05; 48 h K+: 1.13 ± 0.10). (B) Ncad-HA increased TDBTN (1.20 ± 0.04, P < 0.001). (C) Surface Ncad-HA intensity (normalized to neuron area measured in GFP channel): EC1 (0.74 ± 0.06), K+-pulse + Ctrl P. (4.46 ± 0.34, P < 0.001), K+-pulse + EC1 (5.84 ± 0.75, P < 0.001), K+-chase + Ctrl P. (4.39 ± 0.55, P < 0.001), and K+-chase + EC1 (2.54 ± 0.28, P < 0.05 vs. Ctrl, P < 0.05 vs. K+-chase + Ctrl P.). (D) Images of neurons cotransfected with GFP and Ncad-HA, and surface labeled for N-cadherin. (Scale bar, 20 μm.) (E) TDBTN: EC1 (1.08 ± 0.03), K+-pulse + Ctrl P. (1.28 ± 0.03, P < 0.001), K+-pulse + EC1 (1.27 ± 0.03, P < 0.001), K+-chase + Ctrl P. (1.24 ± 0.05, P < 0.001), and K+-chase + EC1 (1.05 ± 0.03, n.s. vs. Ctrl, P < 0.01 vs. K+-chase + Ctrl P.). (F) TDBL: EC1 (1.00 ± 0.03), K+-pulse + Ctrl P. (1.20 ± 0.04, P < 0.01), K+-pulse + EC1 (1.22 ± 0.03, P < 0.001), K+-chase + Ctrl P. (1.20 ± 0.05, P < 0.01), and K+-chase + EC1 (1.02 ± 0.04, n.s. vs. Ctrl, P < 0.01 vs. K+-chase + Ctrl P.). (G) Plot of surface Ncad-HA intensity vs. TDBTN for all neurons, linear regression is dotted line (r 2 = 0.97, P < 0.005). (H) Plot of surface Ncad-HA intensity vs. TDBL, linear regression is dotted line (r 2 = 0.96, P < 0.005). *P < 0.05; **P < 0.01; ***P < 0.001.

Similar articles

Cited by

References

    1. Chen Y, Ghosh A. Regulation of dendritic development by neuronal activity. J Neurobiol. 2005;64:4–10. - PubMed
    1. Parrish JZ, Emoto K, Kim MD, Jan YN. Mechanisms that regulate establishment, maintenance, and remodeling of dendritic fields. Annu Rev Neurosci. 2007;30:399–423. - PubMed
    1. Urbanska M, Blazejczyk M, Jaworski J. Molecular basis of dendritic arborization. Acta Neurobiol Exp (Warsz) 2008;68:264–288. - PubMed
    1. Ye B, Jan YN. The cadherin superfamily and dendrite development. Trends Cell Biol. 2005;15:64–67. - PubMed
    1. Dalva MB, McClelland AC, Kayser MS. Cell adhesion molecules: Signalling functions at the synapse. Nat Rev Neurosci. 2007;8:206–220. - PMC - PubMed

Publication types